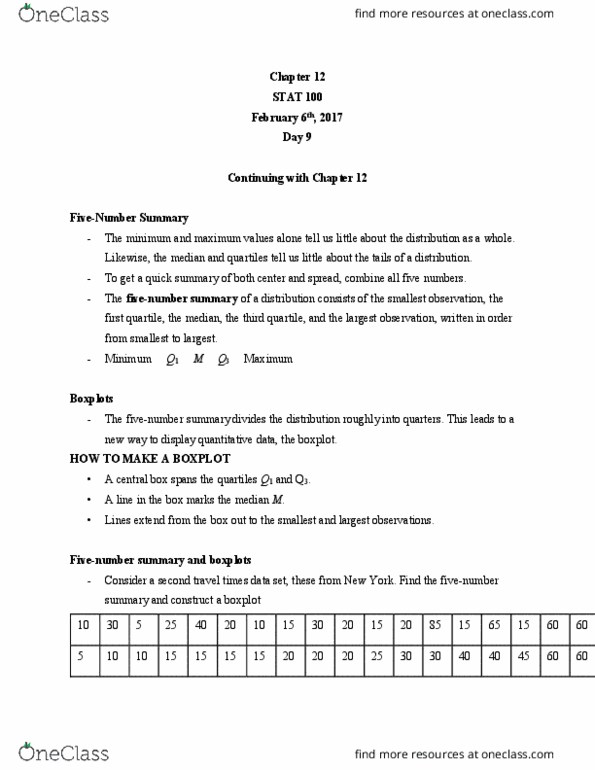
STAT 100 Study Guide - Final Guide: Standard Deviation, Box Plot, Dependent And Independent Variables

7 Dec 2018
School
Department
Course
Professor


8
STAT 100 Full Course Notes
Verified Note
8 documents
Document Summary
Recognize the shape of normal curves, and estimate by eye both the mean and the standard deviation from such a curve. Place the explanatory variable (if any) on the horizontal scale of the plot: describe the direction, form, and strength of the overall pattern of a scatterplot. In particular, recognize positive or negative association and straight-line patterns. Recognize outliers in a scatterplot: judge whether it is appropriate to use correlation to describe the relationship between two quantitative variables. Use the cpi to compare the buying power of dollar amounts from different years. Part 3: recognize that some phenomena are random. Probability describes the long-run regularity of random phenomena: understand the idea of the probability of an event as the proportion of times the event occurs in very many repetitions of a random phenomenon. Use the idea of probability as long-run proportion to think about probability: recognize that short runs of random phenomena do not display the regularity described by probability.