MATH 1F92 Study Guide - Midterm Guide: Histology, Histogram, Central Tendency

1 Dec 2016
School
Department
Course
Professor
Document Summary
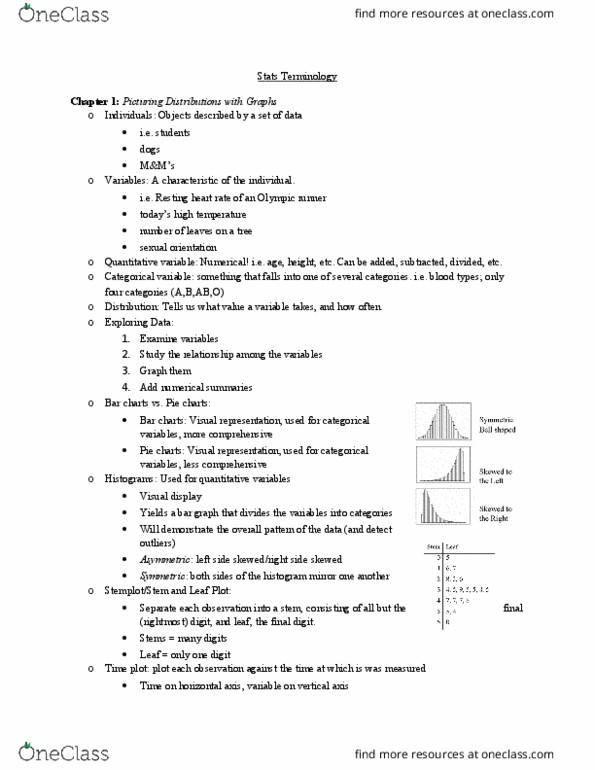
Math (cid:1005)f9(cid:1006): 4 da(cid:455)s of e(cid:454)am re(cid:448)ie(cid:449: mon nov 28- ch3: plots, 5 number summaries, outliers, wed nov 30- ch4: regression, fri dec 3- ch5: probability, mon dec 5- ch6: probability/normal distributions. 2 major features of data: shape, central tendency, mean- when to use, median- calculate; when to use based on stem/leaf or histo. Histogram 1: - right skewed, median (resistant to outliers) Histogram 2: - left skewed, median (resistant to outliers) Determine if certain point is outlier or not. Create a stem/leaf plot from a group of data. Correlation (r)- reps how strong 2 var are correlated & what assoc they have (-1 r 1) Strength (how close to 1 or -1) R = 0. 656 there"s a (cid:373)oderately positi(cid:448)e asso(cid:272) (cid:271)/(cid:449) # days a perso(cid:374) does (cid:272)ardio i(cid:374) a (cid:373)o(cid:374)th & their weight lost. R2 = 0. 430 r = 0. 430 = 0. 656.