Day One - Collecing DC Housing Date
Objective
You will collect housing data from two DC neighborhoods of your chole.
Directions
You will be collecting statistical data in order to study neighborhoods of your own choosing veltineed to collect quantitative and tact corical data for at least 5 DC houses in which you are interested in two different neighborhoods. Use zillow.com and complete the table below.
Neighborhood 1:,
Neighborhood 2:
Address
2005 Tax assessment,
2015 Tax
Assessment, square
Footage,year built, Type of
House, Exterior
Day Two - Visualizing Your Data
Objective
You will develop visual tools to represent your data. These visual tools may include pie charts, histograms, and frequency tables.
Directions
Objective
You will develop visual tools to represent your data. These visual tools may include pie charts, histograms, and frequency tables.
Directions
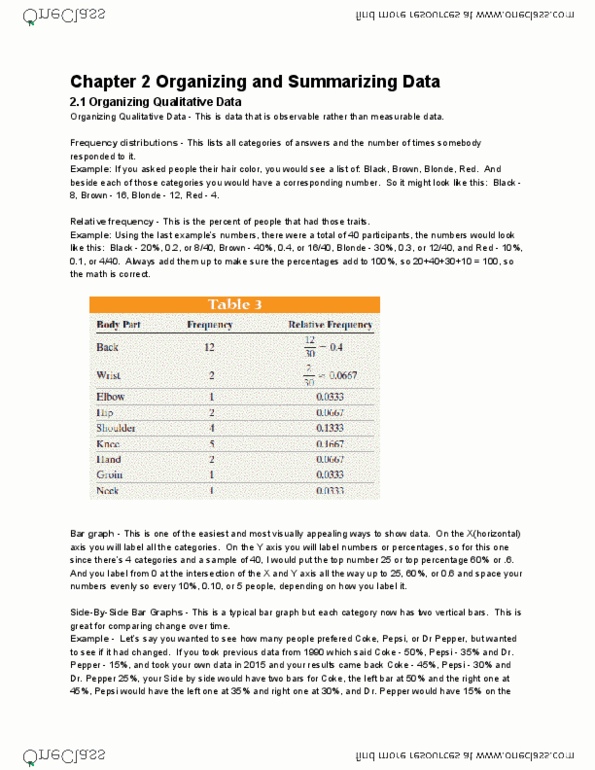
Now that you have gathered a reasonable amount of data on two DC neighborhoods, it is time to engage , it is time to engage in some analysis. You will develop frequency tables, bar graphs, and pie charts for one of the qualitative variables of your choice (House Type or Exterior Material).
A. Creating Histograms
You will need to create 6 histograms, 3 for each neighborhood. https://www.meta-chart.com/
Neighborhood #1:
2005 Tax Assessment
2015 Tax Assessment
Square Footage.
Neighborhood #2:
2005 Tax Assessment
2015 Tax Assessment
Square Footage.
[Neichborhood 1
Histogram 1: 2005 Tax.
Assessment
Histogram 2: 2015 Tax
Assessment
Histogram 3: Square Footage
Neighborhood
Histogram 4: 2005 Tax
Assessment
Histogram 5: 2015 Tax
Assessment
Histogram 6: Square Footage
NOTE: For each histogram, determine the shape of the distribution and explain your reasoning. The distribution can be normal, left skewed, right skewed, bi-modal, or flat. Add descriptions in table above.
Day One - Collecing DC Housing Date
Objective
You will collect housing data from two DC neighborhoods of your chole.
Directions
You will be collecting statistical data in order to study neighborhoods of your own choosing veltineed to collect quantitative and tact corical data for at least 5 DC houses in which you are interested in two different neighborhoods. Use zillow.com and complete the table below.
Neighborhood 1:,
Neighborhood 2:
Address
2005 Tax assessment,
2015 Tax
Assessment, square
Footage,year built, Type of
House, Exterior
Day Two - Visualizing Your Data
Objective
You will develop visual tools to represent your data. These visual tools may include pie charts, histograms, and frequency tables.
Directions
Objective
You will develop visual tools to represent your data. These visual tools may include pie charts, histograms, and frequency tables.
Directions
Now that you have gathered a reasonable amount of data on two DC neighborhoods, it is time to engage , it is time to engage in some analysis. You will develop frequency tables, bar graphs, and pie charts for one of the qualitative variables of your choice (House Type or Exterior Material).
A. Creating Histograms
You will need to create 6 histograms, 3 for each neighborhood. https://www.meta-chart.com/
Neighborhood #1:
2005 Tax Assessment
2015 Tax Assessment
Square Footage.
Neighborhood #2:
2005 Tax Assessment
2015 Tax Assessment
Square Footage.
[Neichborhood 1
Histogram 1: 2005 Tax.
Assessment
Histogram 2: 2015 Tax
Assessment
Histogram 3: Square Footage
Neighborhood
Histogram 4: 2005 Tax
Assessment
Histogram 5: 2015 Tax
Assessment
Histogram 6: Square Footage
NOTE: For each histogram, determine the shape of the distribution and explain your reasoning. The distribution can be normal, left skewed, right skewed, bi-modal, or flat. Add descriptions in table above.