
Stock Market Performance: the Dow Jones Industrial Average (DJIA) and the Standard & Poor's 500 (S & P 500) indexes are used as measures of the overall movement in the Stock market. The DJIA is based on the price movements of 30 large companies; the S & P 500 is an index composed of 500 stocks. Some say the S & P 500is a better measure of the stock market performance because it is broad-based. The closing price for the DJIA and the S & P for 15 weeks, of a previous year follow (Barrow's website).
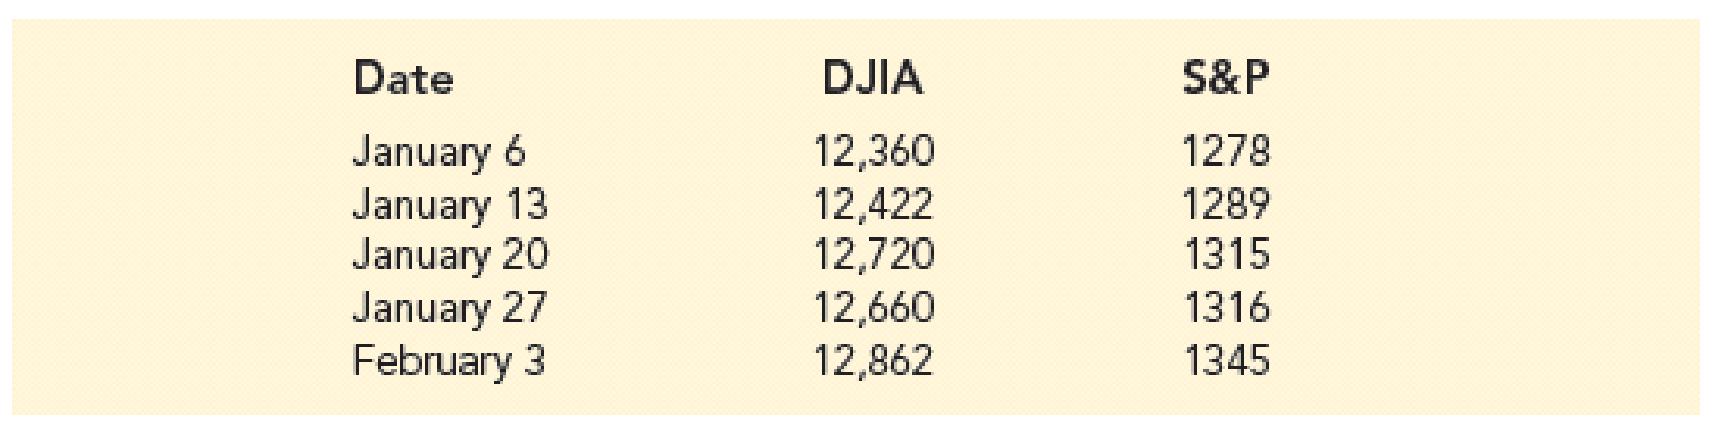
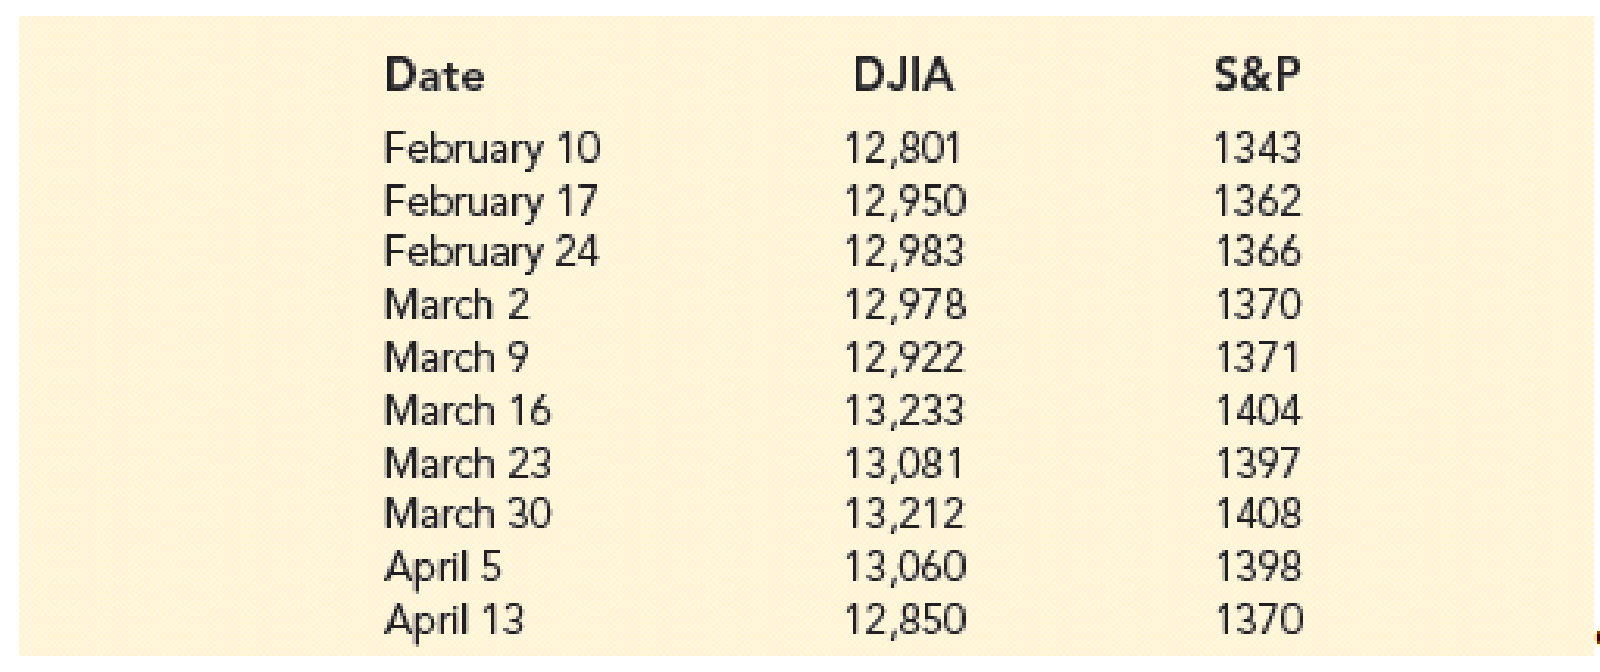
a. Develop a scatter diagram with DJIA as the independent variable.
b. Develop the estimated regression equation.
c. Test for a significant relationship. 
d. Did the estimated regression equation provide a good fit? Explain.
e. Suppose that the closing price for DJIA is 13,500. Predict the closing for the S & P 500.
f. Should we be concerned that the DJIA value of 13,500 used to predict the S & P 500 value in part (e) is beyond the range of the data used to develop the estimated regression equation?
Stock Market Performance: the Dow Jones Industrial Average (DJIA) and the Standard & Poor's 500 (S & P 500) indexes are used as measures of the overall movement in the Stock market. The DJIA is based on the price movements of 30 large companies; the S & P 500 is an index composed of 500 stocks. Some say the S & P 500is a better measure of the stock market performance because it is broad-based. The closing price for the DJIA and the S & P for 15 weeks, of a previous year follow (Barrow's website).
a. Develop a scatter diagram with DJIA as the independent variable.
b. Develop the estimated regression equation.
c. Test for a significant relationship.
d. Did the estimated regression equation provide a good fit? Explain.
e. Suppose that the closing price for DJIA is 13,500. Predict the closing for the S & P 500.
f. Should we be concerned that the DJIA value of 13,500 used to predict the S & P 500 value in part (e) is beyond the range of the data used to develop the estimated regression equation?

Related textbook solutions

Related questions
The following data show Morning's Fair Value estimate and the Share Price for 28 companies. Fair Value is an estimate of a company's value per share that takes into account estimates of the company's growth, profitability, riskiness, and other factors over the next five years (Morningstar Stocks 500, 2008 edition).
| Company | Fair Value ($) | Share Price ($) |
| Air Products and Chemicals | 80 | 98.63 |
| Allied Waste Materials | 17 | 11.02 |
| America Mobile | 83 | 61.39 |
| AT & T | 35 | 41.56 |
| Bank of America | 70 | 41.26 |
| Barclays | 68 | 40.37 |
| Citigroup | 53 | 29.44 |
| Costco Wholesale Corp | 75 | 69.76 |
| Covidien | 58 | 44.29 |
| Darden Restaurants | 52 | 27.71 |
| Dun & Bradstreet | 87 | 88.63 |
| Equifax | 42 | 36.36 |
| Gannett Co. | 38 | 39.00 |
| Genuine Parts | 48 | 46.30 |
| GlaxoSmithKline PLC | 57 | 50.39 |
| Iron Mountain | 33 | 37.02 |
| ITT Corporation | 83 | 66.04 |
| Johnson & Johnson | 80 | 66.70 |
| Las Vegas Sands | 98 | 103.05 |
| Macro vision | 23 | 18.33 |
| Marriot International | 39 | 34.18 |
| Nalco Holding Company | 29 | 24.18 |
| National Interstate | 25 | 33.10 |
| Portugal Telecom | 15 | 13.02 |
| Qualcomm | 48 | 39.35 |
| Royal Dutch Ltd. | 87 | 84.20 |
| SanDisk | 60 | 33.17 |
| Time Warner | 42 | 27.60 |
(a) Develop the estimated regression equation that could be used to estimate the share price given the fair value.
(b) At the 0.05 level of significance, is there a significant relationship between the two variables.
(c) Use the estimated regression equation to predict the share price for a company that has a fair value of $50.
(d) Do you believe the estimated regression equation would provide a good prediction of the share price? Use R2 to support your answer.
