For each of the net force versus time graphs in Parts A, B, and C, construct a possible corresponding graph of velocity v(t), or position x(t), versus time. Assume one-dimensional motion. Plot position versus time.
For unlimited access to Homework Help, a Homework+ subscription is required.
Shown below is a graph of velocity versus time for a moving object. The object starts at position x = 0. What is the final position (as measured from x = 0) after it experiences the motion described by the graph, from t = 0 seconds to t = 5 seconds?
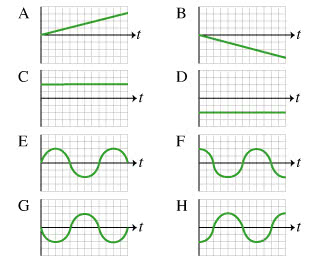
While working on her bike, Amanita turns it upsidedown and gives the front wheel a counterclockwise spin. It spins atapproximately constant speed for a few seconds. During this portionof the motion, she records the x and y positionsand velocities, as well as the angular position and angularvelocity, for the point on the rim designated by the yellow-orangedot in the figure. (Intro 1 figure) Let theorigin of the coordinate system be at the center of the wheel, thepositive x direction to the right, the positive yposition up, and the positive angular position counterclockwise.The graphs (Intro 2 figure) begin when thepoint is at the indicated position. One graph may be the correctanswer to more than one part.
Intro 1
Intro 2
1. Which of the graphs corresponds to xposition versus time?
2. Which of the graphs corresponds to angularposition versus time?
3. Which of the graphs corresponds to yvelocity versus time?
4. Which of the following graphs corresponds toangular velocity versus time?
The figure shows three graphs, A, B, C, which collectively describe the motion of an object in one dimension. The horizontal axis of each graph is time (symbol t). The vertical axes of the graphs are different. For one graph the vertical axis is position (symbol x), for another, it is the velocity (symbol v), and for another, it is acceleration (symbol a). Where the axes across is the point of zero for both time and the quantity corresponding to the vertical axis. Part A: For which sequence of graphs is the vertical coordinate position, velocity, and acceleration, respectively? (e.g., If you think graph Y is position versus time, graph X is velocity versus time, and graph Z is acceleration versus time, then your answer is Y, X, Z.). Multiple choice: 1)C, A, B 2)A, C, B 3)C, B, A 4)B, C, A 5)B, A, C 6)A, B, C. Part (b) Which one of the following situations can be most accurately represented by the graph, consistent with your answer to part (a)? (1) A car driving in the negative x-direction suddenly shifts into reverse and, with tires spinning, slows to a momentary stop before beginning to move in the position x-direction. (2)A car driving in the position x-direction slams on its brakes and comes to rest. (3) A rock is dropped from the rest from the top of a tall building. Assume air drag can be neglected, in which case its speed increases by the same amount each second. Take upward to be the position x-direction. (4) A sprinter runs a 100-meter dash and she runs in the negative x-direction. Starting from rest, she has a constant acceleration for the first 50 meters, then a constant speed for the remaining 50. Multiple choices: 1)4, 2)3, 3)2, 4)1.