1
answer
0
watching
81
views

plumgoat29Lv1
11 Dec 2019
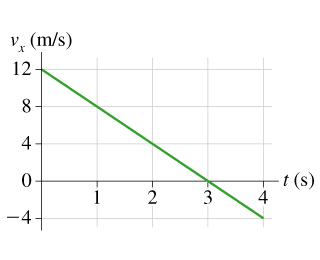
An object's acceleration graph is shown in the figure. Its velocity at t=0 s is vx = 2.0 m/s. How does velocity graph look like?

An object's acceleration graph is shown in the figure. Its velocity at t=0 s is vx = 2.0 m/s. How does velocity graph look like?


Amal JeevaLv10
23 Sep 2020