1
answer
0
watching
220
views

11 Dec 2019
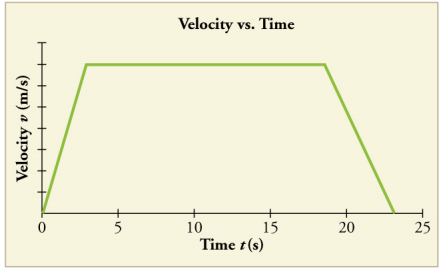
Consider the velocity vs. time graph of a person in an elevator shown in Figure 2.58. Suppose the elevator is initially at rest. It then accelerates for 3 seconds, maintains that velocity for 15 seconds, then decelerates for 5 seconds until it stops. The acceleration for the entire trip is not constant so we cannot use the equations of motion from Motion Equations for Constant Acceleration in One Dimension for the complete trip. (We could, however, use them in the three individual sections where acceleration is a constant.) Sketch graphs of (a) position vs. time and (b) acceleration vs. time for this trip.
Consider the velocity vs. time graph of a person in an elevator shown in Figure 2.58. Suppose the elevator is initially at rest. It then accelerates for 3 seconds, maintains that velocity for 15 seconds, then decelerates for 5 seconds until it stops. The acceleration for the entire trip is not constant so we cannot use the equations of motion from Motion Equations for Constant Acceleration in One Dimension for the complete trip. (We could, however, use them in the three individual sections where acceleration is a constant.) Sketch graphs of (a) position vs. time and (b) acceleration vs. time for this trip.

Supratim PalLv10
30 Oct 2020


