0
answers
0
watching
311
views
20 Nov 2019
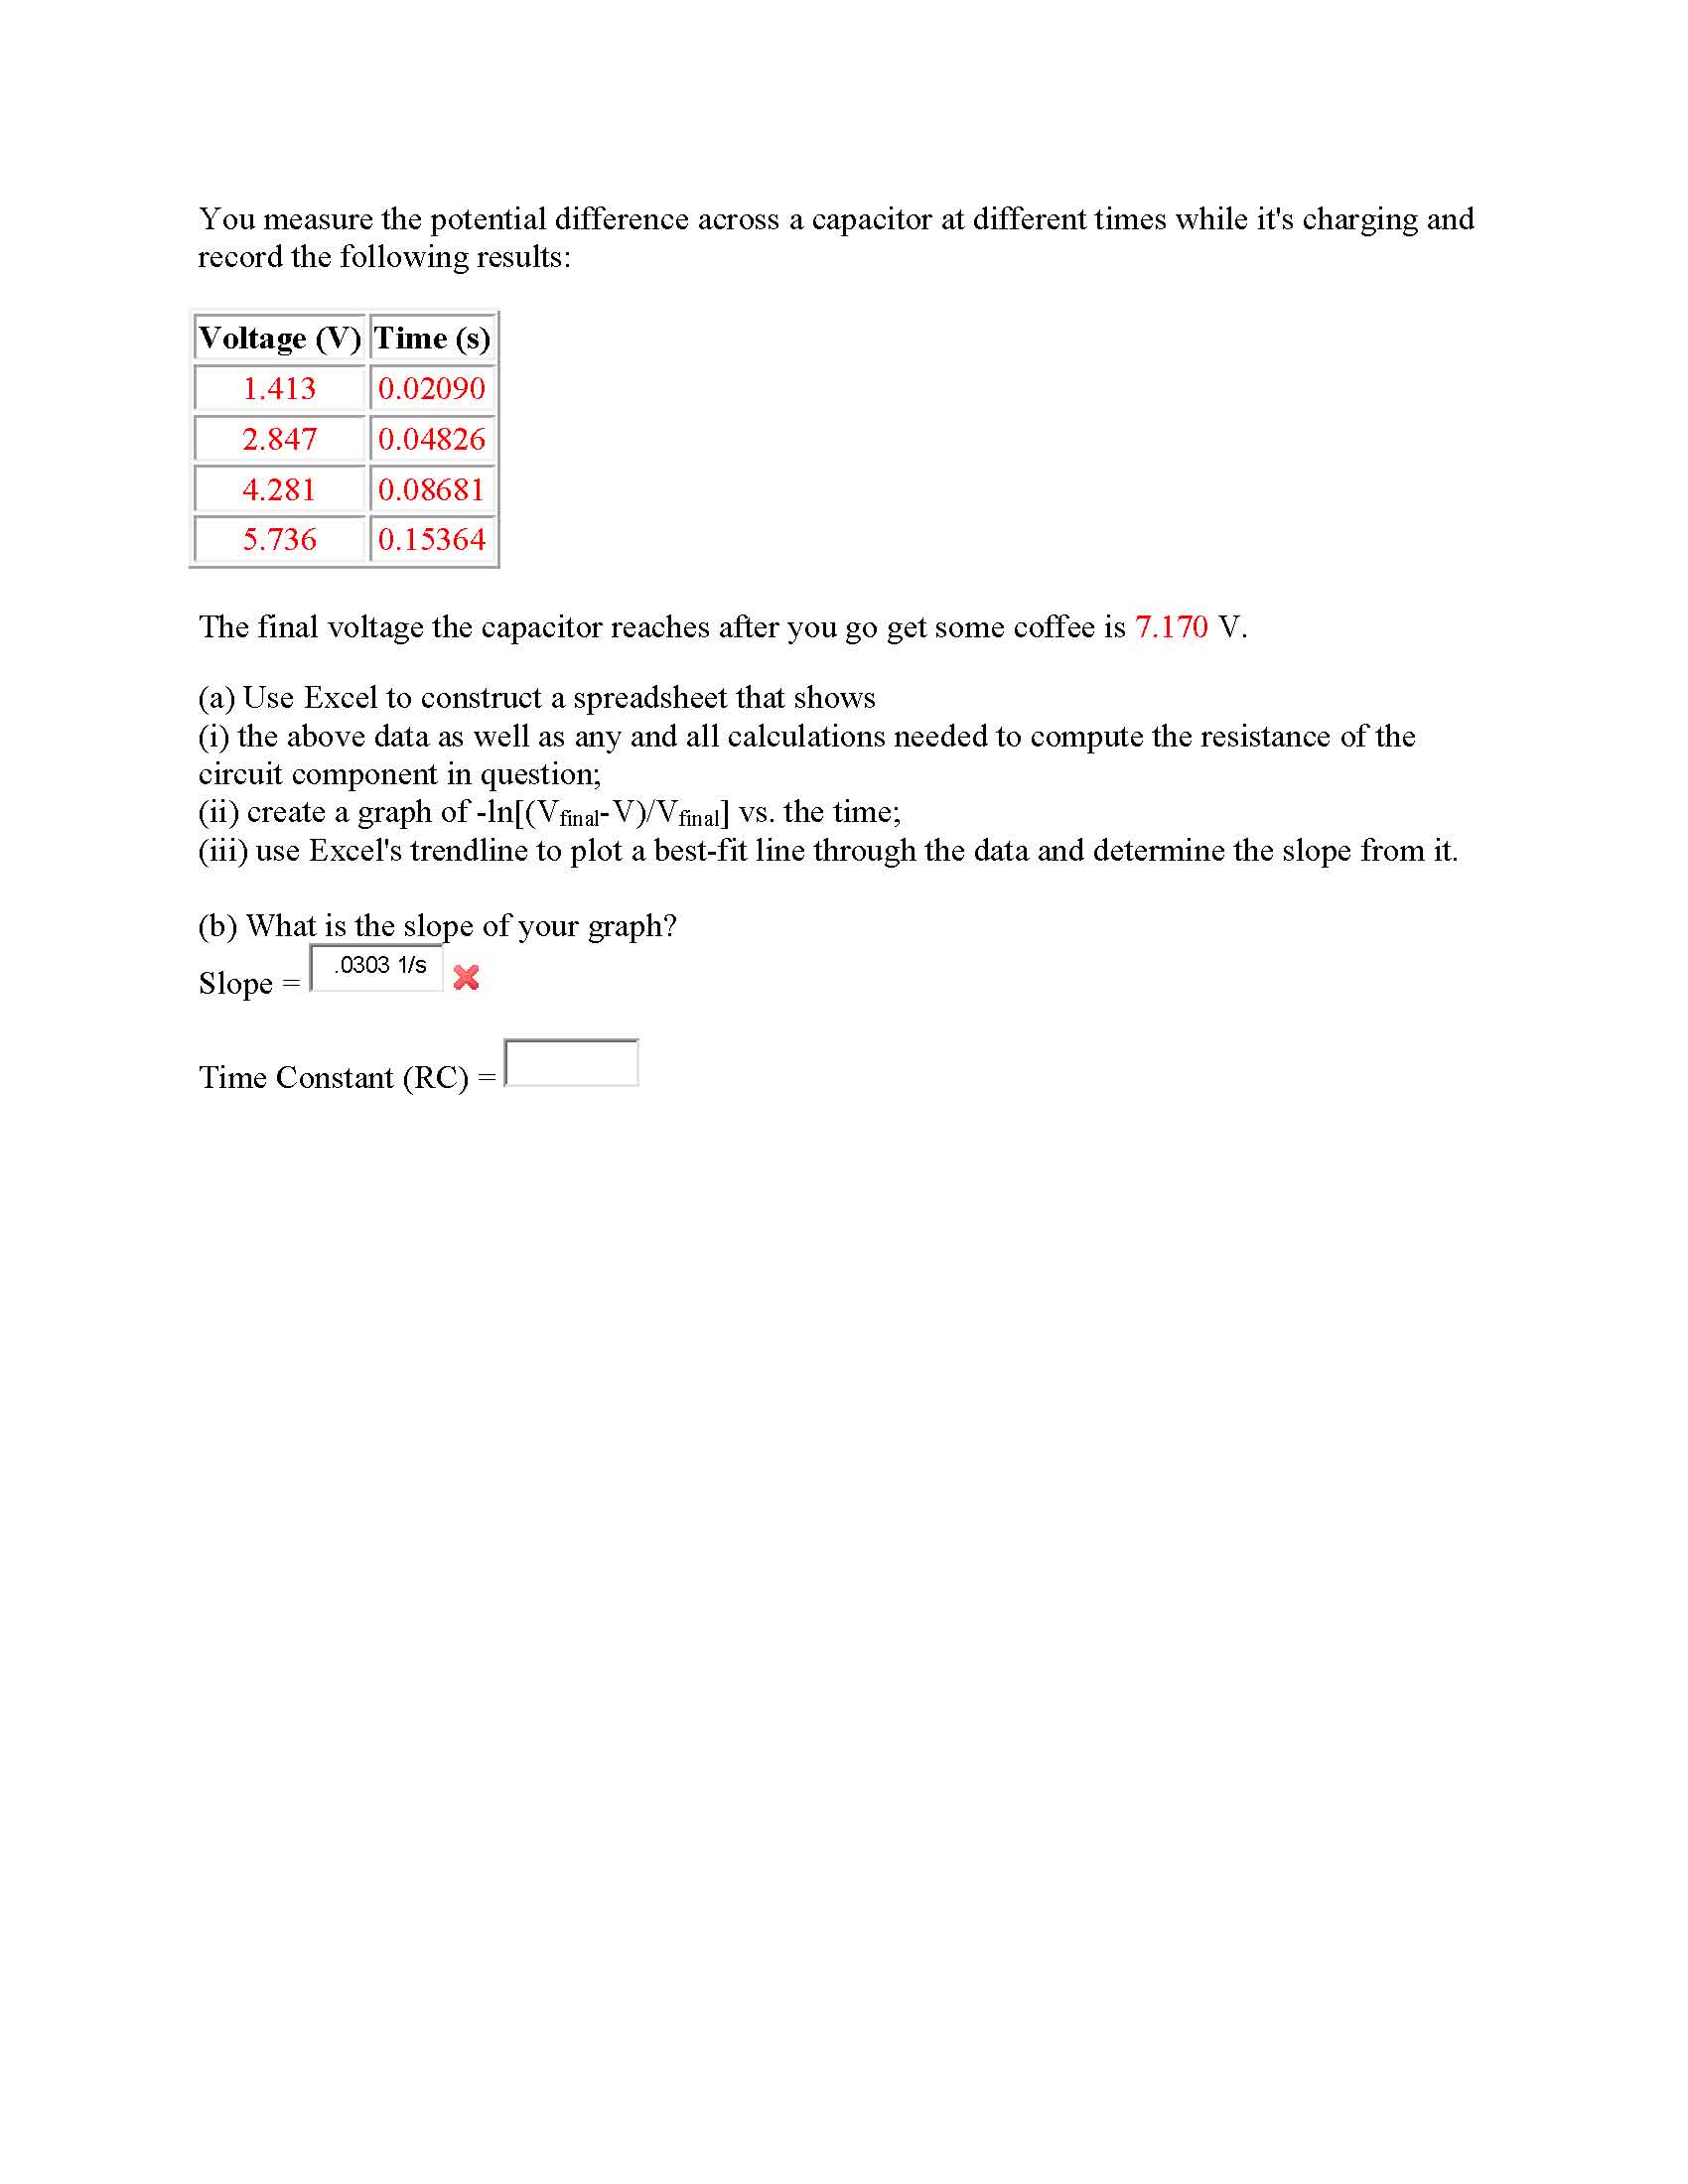
You measure the potential difference across a capacitor at different times while it's charging and record the following results: The final voltage the capacitor reaches after you go get some coffee is 7.170 V. Use Excel to construct a spreadsheet that shows the above data as well as any and all calculations needed to compute the resistance of the circuit component in question; create a graph of -ln[(Vfmai-V)/Vfmai] vs. the time; use Excel's trendline to plot a best-fit line through the data and determine the slope from it. What is the Slope of your graph? Time Constant (RC)