1
answer
4
watching
2,887
views
2 May 2018
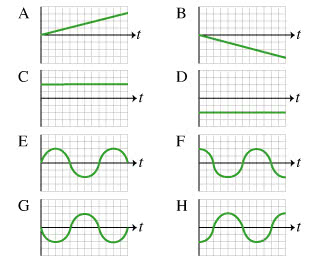
Q2.2 The black dots at the top of Fig. 22.2 represent a series of high-speed photographs of an insect flying in a straight line from left to right in the positive x-direction). Which of the graphs in Fig. 22.2 most plausibly depicts this insect's motion? Figure 2.2
Q2.2 The black dots at the top of Fig. 22.2 represent a series of high-speed photographs of an insect flying in a straight line from left to right in the positive x-direction). Which of the graphs in Fig. 22.2 most plausibly depicts this insect's motion? Figure 2.2

Liked by jemimahacuna2904

Jarrod RobelLv2
4 May 2018