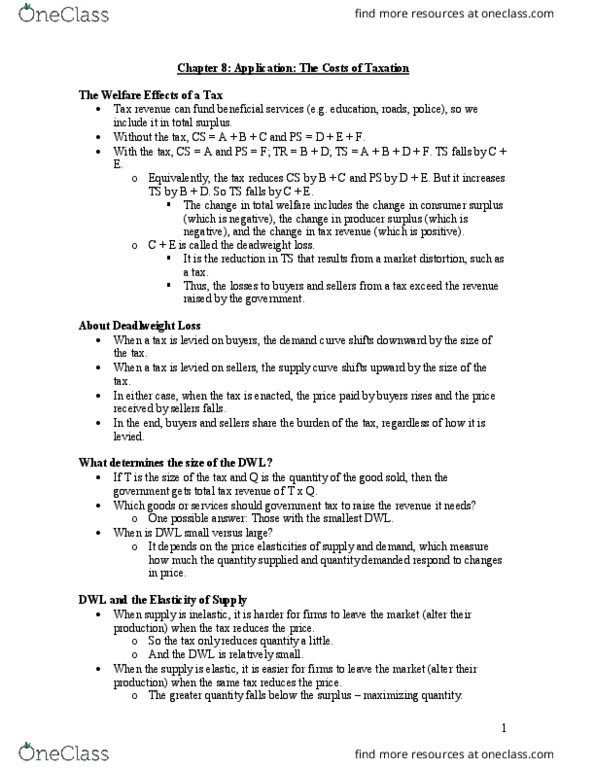
The table below illustrates the market for Internet services. Use a demand-supply
graph to answer the following questions.
Price Q Demanded Q Supplied
(dollars per month) (units per month)
0 30 0
10 25 10
20 20 20
30 15 30
40 10 40
50 5 50
60 0 60
a. What is the market price of Internet services?__________
b. If the government imposes a tax of $15 a month on the market, what price
would the buyer of an Internet service pay?__________
c. What price would the seller of the Internet service
receive?____________________
d. Does the buyer or the seller pay more of the tax? Explain
e. What is the tax revenue collected by the government?__________
f. What is the deadweight loss created by the tax?__________
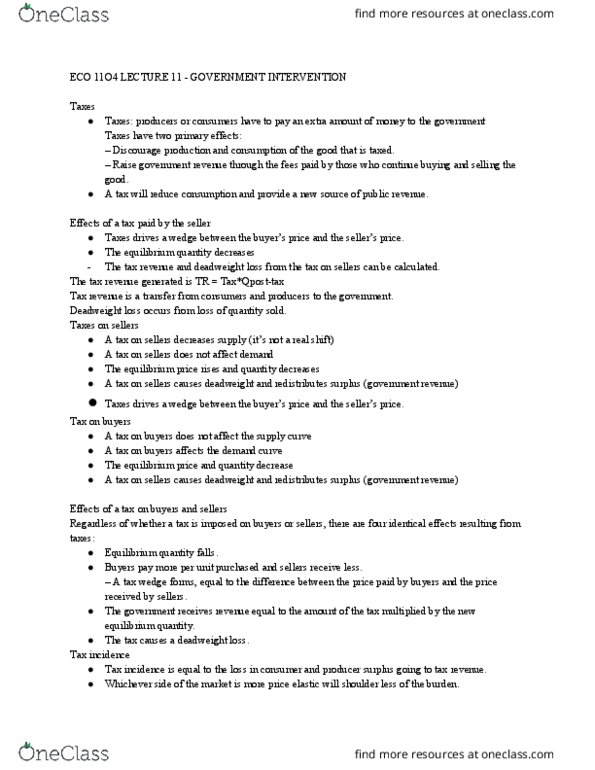

Related textbook solutions


Related questions

What would the new equilibrium price of tutoring services be if Carlos decided to stop tutoring?
| Price per hour | Quantity Supplied by Ann | Quantity Supplied by Carlos | Quantity Supplied by Bob | Market Quantity Supplied | Market Quantity Demanded |
| $50 | 94 | 19 | 35 | 148 | 5 |
| 45 | 93 | 14 | 33 | 140 | 8 |
| 40 | 90 | 10 | 30 | 130 | 11 |
| 35 | 81 | 6 | 27 | 114 | 16 |
| 30 | 68 | 2 | 20 | 90 | 22 |
| 25 | 50 | 0 | 12 | 62 | 30 |
| 20 | 32 | 0 | 7 | 39 | 39 |
| 15 | 20 | 0 | 0 | 20 | 47 |
| 10 | 10 | 0 | 0 | 10 | 57 |