1
answer
0
watching
86
views
27 Feb 2018
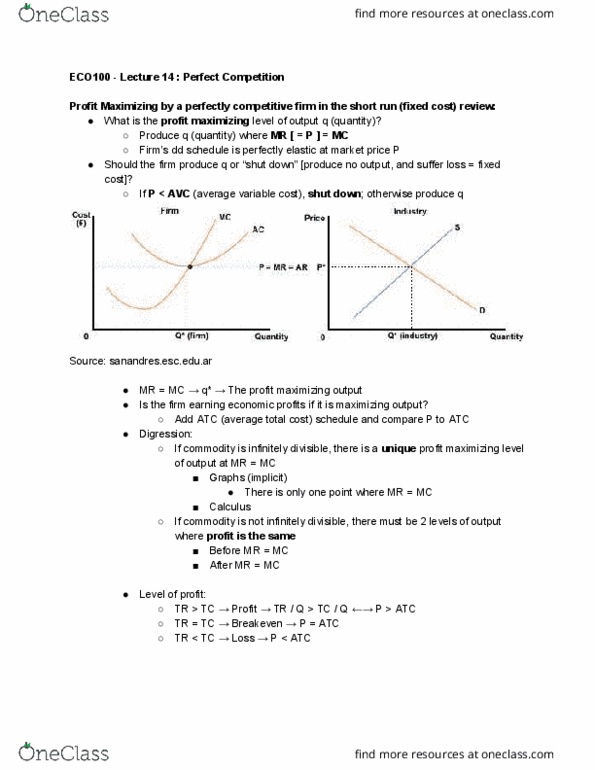
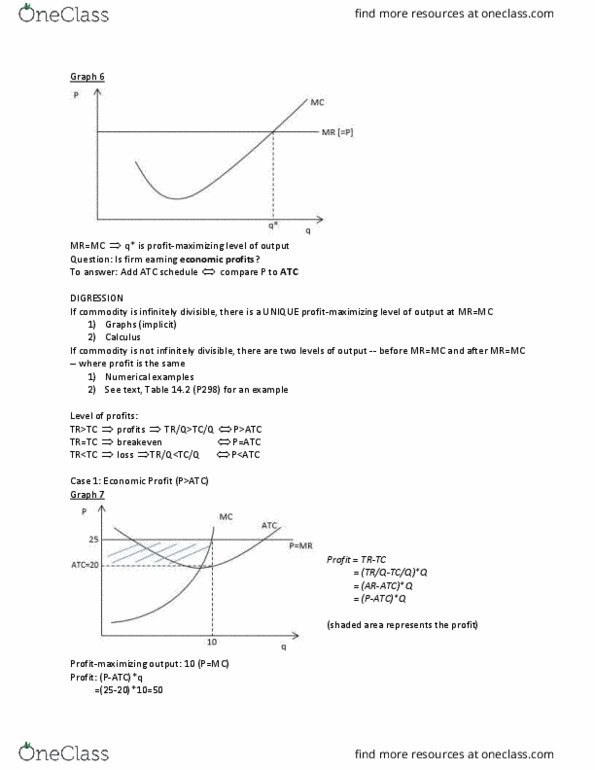
II. Short Answer - For all questions, print very clearly, precisely and completely label all graphs. Grades will depend on correctness, completeness, and legibility. Use only the space allotted. 1. (12 points) As developed in class, in the three graphs below, graph the following cases for a perfectly competitive firm producing optimal output and making SR economic profits equal zero, where: a) Initially (at low levels of output) MC > MR, and b) MC initially decline and then begin to increase (U-shaped). No discussion is necessary. Be sure and label all graphs and all axes. Figure A: plot MR, MC, AVC, ATC for the firm. Figure B: plot for the firm TR, TVC, TC Figure C: plot the profit function for the firm. Figure A Figure B Figure C
II. Short Answer - For all questions, print very clearly, precisely and completely label all graphs. Grades will depend on correctness, completeness, and legibility. Use only the space allotted. 1. (12 points) As developed in class, in the three graphs below, graph the following cases for a perfectly competitive firm producing optimal output and making SR economic profits equal zero, where: a) Initially (at low levels of output) MC > MR, and b) MC initially decline and then begin to increase (U-shaped). No discussion is necessary. Be sure and label all graphs and all axes. Figure A: plot MR, MC, AVC, ATC for the firm. Figure B: plot for the firm TR, TVC, TC Figure C: plot the profit function for the firm. Figure A Figure B Figure C

Irving HeathcoteLv2
27 Feb 2018