1
answer
0
watching
164
views
31 May 2020
Table 1. Summary of Mass spectra data of compound 
M/Z
Relative intensity
103.0
5.9
104.0
2.9
105.0
28.9
106.0
65.9
107.0
5.8
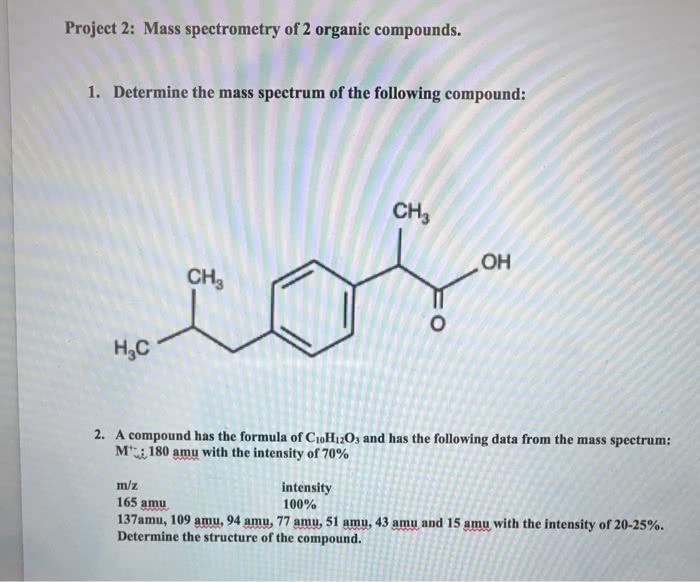
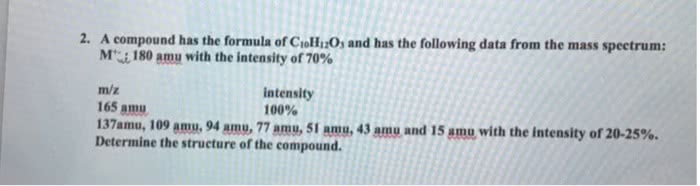
With the help of intensity data from mass spectra of compound , determine the molecular mass of compound .
Table 1. Summary of Mass spectra data of compound
|
M/Z |
Relative intensity |
|
103.0 |
5.9 |
|
104.0 |
2.9 |
|
105.0 |
28.9 |
|
106.0 |
65.9 |
|
107.0 |
5.8 |
With the help of intensity data from mass spectra of compound , determine the molecular mass of compound .


Elin HesselLv2
24 Jul 2020

Related textbook solutions

Basic Chemistry
5 Edition,
Timberlake
ISBN: 9780134138046

Principles of Chemistry Molecular Approach
4th Edition,
Tro
ISBN: 9780134112831

Chemistry: Structure and Properties
2nd Edition,
Tro
ISBN: 9780134293936

Principles of Chemistry Molecular Approach
3rd Edition, 2014
Tro
ISBN: 9780321971944

Chemistry: A Molecular Approach
3rd Edition,
Tro
ISBN: 9780321809247

Chemistry: A Molecular Approach
5th Edition,
Tro
ISBN: 9780134874371

Principles of Chemistry: A Molecular Approach
4th Edition,
Tro
ISBN: 9780134895741

Chemistry: The Central Science
14th Edition, 2017
Brown
ISBN: 9780134414232