i need help graphing this information based on data 1 and data 2 based on information below provided
Activity 1: Buffer Solution Preparation
The following eight solutions are prepared in the eight plastic cups labeled with the solution names.
1. Based on the Preparation calculations, prepared 50 mL of a 0.10 M solution of sodium acetate in the cup labeled sodium acetate. 0.050L x 0.10M= 0.005 x 82.03= .41g CH3COONa
2. 100 mL of pure water was added to the cup labeled water
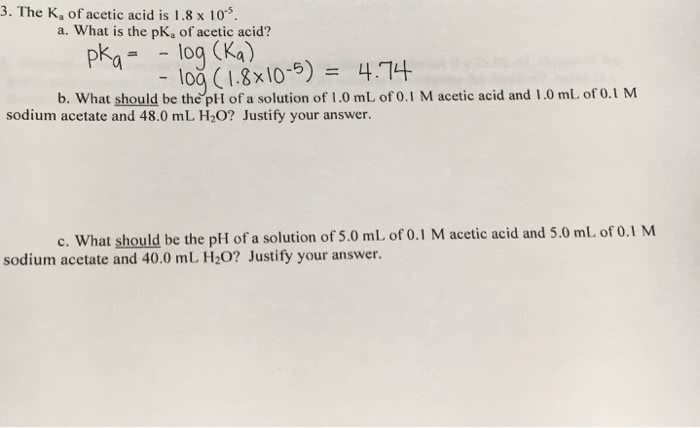
3. 50 mL of a 0.1 M acetic acid solution was added to the cup labeled acetic acid.
4. 10 mL of a 0.1 M NaOH solution (0.10M)(10mL)=(1M)(V2)V2=1mL NaOH
5. 10 mL of a 0.1M HCl solution (.10M)(10mL)=(1M)(V2)V2=1mL HCl
6. 10 mL of a pH 3.7 buffer (9.1 mL of 0.1 M acetic acid and 0.9 mL of sodium acetate)
7. 10 mL of a pH 4.7 buffer (5.0 mL of 0.1 M acetic acid and 5.0 mL of sodium acetate)
8. 10 mL of a pH 5.7 buffer (0.9 mL of 0.1 M acetic acid and 9.1 mL of sodium acetate)
The following amount of Bogenâs Universal Indicator was added to each solution: 10 drops to the acetic acid and the sodium acetate solutions, 20 drops to the 100 mL water, and 2 drops to the NaOH and the HCl solutions.
The 24-well plate was placed on to a sheet of plain white paper as shown below, and one drop of universal indicator was added to each well. The following amount of solutions was transferred the appropriate pipets to each well.
a. 1 mL of 0.1 M acetic acid to all four wells in the first row of the 24-well plate.
b. 1 mL of water to all four wells in the second row of the plate
c. 1 mL of 0.1 M sodium acetate solution to all four wells in the third row
d. 1 mL of the 3.7 pH buffer to all four wells in the fourth row
e. 1 mL of the 4.7 pH buffer to all four wells in the fifth row
f. 1 mL of the 5.7 pH buffers to all four wells in the sixth row
The color of the solution for each row was recorded, and a photo of the plate was taken.
The approximate pH of the solution was determined based on the indicator color chart.
One drop of 0.1 M HCl was added to the second well of each row, 1 drop of 0.1 M NaOH was added to the third well of each row, and 10 drops of 0.1 M NaOH was added to the fourth well of each row.
The color and corresponding pH was recorded.
A photo of the plate showing the colors in each well was taken.
0.1M
Acetic
Acid
water
0.1M
Sodium
Acetate
pH 3.7
Buffer
pH 4.7
Buffer
pH 5.7
Buffer
Initial Color
yellow
green
pink
orange
yellow
Initial pH
4
6
7
4
5
6
Color after 1 drop HCl
Pink
Pink
pH after 1 drop HCl
4
4
7
4
5
6
Color after 1 drop NaOH
Pink
blue
blue
blue
pH after 1 drop NaOH
4
8
8
4
5
8
Color after 10 drops NaOH
Pink
purple
purple
purple
pH after 10 drops NaOH
4
10
10
4
5
10
Activity 2: Buffering Capacity of a Solution
The 24-well plate was placed on to a sheet of plain white paper at 90°so that it is four rows by six columns
20 mL of pH 4.7 buffer was prepared by doubling the volumes calculate in from activity 1 in the appropriate cup, and 2 mL of the solution was added into all 6 wells in the first row.
5 mL of the pH 4.7 buffer solution was diluted with 15 mL of purified water containing the indicator and poured into a clean cup. 2 mL of this first dilution was added to all the wells in the second row.
5 mL of the first dilution was diluted with 15 mL of purified water containing the indicator and poured into a clean cup. 2 mL of this second dilution was added to all the wells in the third row.
5 mL of the second dilution was diluted with 15 mL of purified water containing the indicator and poured into a clean cup. 2 mL of this third dilution was added to all the wells in the fourth row.
An additional drop of indicator was added to each well to make the color more visible. The color of the first well of each row was recorded.
One drop of 0.1 M NaOH solution was added to the second well in each row, two drops of 0.1 M NaOH solution was added to the third well of each row, three drops to the fourth well, four drops to the fifth well, and five drops to the sixth well. The color and corresponding pH of each well was recorded, and a photo of the plate showing the colors in each well was taken. The sodium acetate molar concentration of each dilution was calculated.
pH 4.7 Buffer
First Dilution
Second Dilution
Third Dilution
Initial Color
orange
orange
orange
orange
Initial pH
5
5
5
5
Color after 1 drop NaOH
orange
orange
Blue
purple
pH after 1 drop NaOH
5
5
8
10
Color after 2 drops NaOH
orange
yellow
Blue
purple
pH after 2 drops NaOH
5
6
8
10
Color after 3 drops NaOH
orange
green
purple
purple
pH after 3 drops NaOH
5
7
9
10
Color after 4 drops NaOH
orange
purple
purple
purple
pH after 4 drops NaOH
5
9
9
10
Color after 5 drops NaOH
orange
purple
purple
purple
pH after 5 drops NaOH
5
9
9
10
Concentration of sodium acetate
0.1 M
2.5x10^-2 M
6.3x10^ -3 M
1.6x10^-3 M
i need help graphing this information based on data 1 and data 2 based on information below provided
Activity 1: Buffer Solution Preparation
The following eight solutions are prepared in the eight plastic cups labeled with the solution names.
1. Based on the Preparation calculations, prepared 50 mL of a 0.10 M solution of sodium acetate in the cup labeled sodium acetate. 0.050L x 0.10M= 0.005 x 82.03= .41g CH3COONa
2. 100 mL of pure water was added to the cup labeled water
3. 50 mL of a 0.1 M acetic acid solution was added to the cup labeled acetic acid.
4. 10 mL of a 0.1 M NaOH solution (0.10M)(10mL)=(1M)(V2)V2=1mL NaOH
5. 10 mL of a 0.1M HCl solution (.10M)(10mL)=(1M)(V2)V2=1mL HCl
6. 10 mL of a pH 3.7 buffer (9.1 mL of 0.1 M acetic acid and 0.9 mL of sodium acetate)
7. 10 mL of a pH 4.7 buffer (5.0 mL of 0.1 M acetic acid and 5.0 mL of sodium acetate)
8. 10 mL of a pH 5.7 buffer (0.9 mL of 0.1 M acetic acid and 9.1 mL of sodium acetate)
The following amount of Bogenâs Universal Indicator was added to each solution: 10 drops to the acetic acid and the sodium acetate solutions, 20 drops to the 100 mL water, and 2 drops to the NaOH and the HCl solutions.
The 24-well plate was placed on to a sheet of plain white paper as shown below, and one drop of universal indicator was added to each well. The following amount of solutions was transferred the appropriate pipets to each well.
a. 1 mL of 0.1 M acetic acid to all four wells in the first row of the 24-well plate.
b. 1 mL of water to all four wells in the second row of the plate
c. 1 mL of 0.1 M sodium acetate solution to all four wells in the third row
d. 1 mL of the 3.7 pH buffer to all four wells in the fourth row
e. 1 mL of the 4.7 pH buffer to all four wells in the fifth row
f. 1 mL of the 5.7 pH buffers to all four wells in the sixth row
The color of the solution for each row was recorded, and a photo of the plate was taken.
The approximate pH of the solution was determined based on the indicator color chart.
One drop of 0.1 M HCl was added to the second well of each row, 1 drop of 0.1 M NaOH was added to the third well of each row, and 10 drops of 0.1 M NaOH was added to the fourth well of each row.
The color and corresponding pH was recorded.
A photo of the plate showing the colors in each well was taken.
| 0.1M Acetic Acid | water | 0.1M Sodium Acetate | pH 3.7 Buffer | pH 4.7 Buffer | pH 5.7 Buffer | ||||
| Initial Color | yellow | green | pink | orange | yellow | ||||
| Initial pH | 4 | 6 | 7 | 4 | 5 | 6 | |||
| Color after 1 drop HCl | Pink | Pink | |||||||
| pH after 1 drop HCl | 4 | 4 | 7 | 4 | 5 | 6 | |||
| Color after 1 drop NaOH | Pink | blue | blue | blue | |||||
| pH after 1 drop NaOH | 4 | 8 | 8 | 4 | 5 | 8 | |||
| Color after 10 drops NaOH | Pink | purple | purple | purple | |||||
| pH after 10 drops NaOH | 4 | 10 | 10 | 4 | 5 | 10 | |||
Activity 2: Buffering Capacity of a Solution
The 24-well plate was placed on to a sheet of plain white paper at 90°so that it is four rows by six columns
20 mL of pH 4.7 buffer was prepared by doubling the volumes calculate in from activity 1 in the appropriate cup, and 2 mL of the solution was added into all 6 wells in the first row.
5 mL of the pH 4.7 buffer solution was diluted with 15 mL of purified water containing the indicator and poured into a clean cup. 2 mL of this first dilution was added to all the wells in the second row.
5 mL of the first dilution was diluted with 15 mL of purified water containing the indicator and poured into a clean cup. 2 mL of this second dilution was added to all the wells in the third row.
5 mL of the second dilution was diluted with 15 mL of purified water containing the indicator and poured into a clean cup. 2 mL of this third dilution was added to all the wells in the fourth row.
An additional drop of indicator was added to each well to make the color more visible. The color of the first well of each row was recorded.
One drop of 0.1 M NaOH solution was added to the second well in each row, two drops of 0.1 M NaOH solution was added to the third well of each row, three drops to the fourth well, four drops to the fifth well, and five drops to the sixth well. The color and corresponding pH of each well was recorded, and a photo of the plate showing the colors in each well was taken. The sodium acetate molar concentration of each dilution was calculated.
| pH 4.7 Buffer | First Dilution | Second Dilution | Third Dilution | |
| Initial Color | orange | orange | orange | orange |
| Initial pH | 5 | 5 | 5 | 5 |
| Color after 1 drop NaOH | orange | orange | Blue | purple |
| pH after 1 drop NaOH | 5 | 5 | 8 | 10 |
| Color after 2 drops NaOH | orange | yellow | Blue | purple |
| pH after 2 drops NaOH | 5 | 6 | 8 | 10 |
| Color after 3 drops NaOH | orange | green | purple | purple |
| pH after 3 drops NaOH | 5 | 7 | 9 | 10 |
| Color after 4 drops NaOH | orange | purple | purple | purple |
| pH after 4 drops NaOH | 5 | 9 | 9 | 10 |
| Color after 5 drops NaOH | orange | purple | purple | purple |
| pH after 5 drops NaOH | 5 | 9 | 9 | 10 |
| Concentration of sodium acetate | 0.1 M | 2.5x10^-2 M | 6.3x10^ -3 M | 1.6x10^-3 M |

Related textbook solutions

Basic Chemistry

Principles of Chemistry Molecular Approach

Chemistry: Structure and Properties

Principles of Chemistry Molecular Approach

Chemistry: A Molecular Approach

Chemistry: A Molecular Approach

Principles of Chemistry: A Molecular Approach