The plot of [A] versus t is linear for the zero-order reaction, the plot of ln[A]versus t is linear for the first-order reaction, and the plot of 1[A] versus t is linear for the second-order reaction. [A]represents the concentration of the reactant A.
Reaction order
Linear plot
zero
[A] vs. t
first
ln[A] vs. t
second
1[A] vs. t
The linearity of each graph can be used to identify the order of a reaction.
Characteristics of second-order reactions
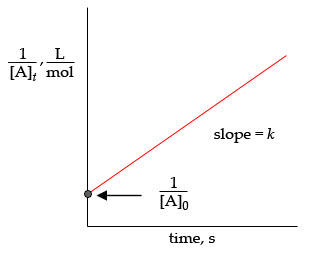
For a second-order reaction, [A]âproducts, the rate of the reaction is given as rate= k[A]2, where k is the rate constant and [A] is the concentration of reactant A. The integrated rate law for second-order reactions is 1[A]t=kt+1[A]0, where [A]t is the concentration of reactant Aat time t, k is the rate constant, and [A]0 is the initial concentration of reactant A. This equation is of the type y=mx+b. Therefore, the plot of 1[A]tversus time is always a straight line with a slope k and a y intercept 1[A]0.
Consider the second-order reaction: 2HI(g)âH2(g)+I2(g) Use the simulation to find the initial concentration [HI]0 and the rate constant k for the reaction. What will be the concentration of HI after t = 7.05Ã1010 s ([HI]t) for a reaction starting under the condition in the simulation?