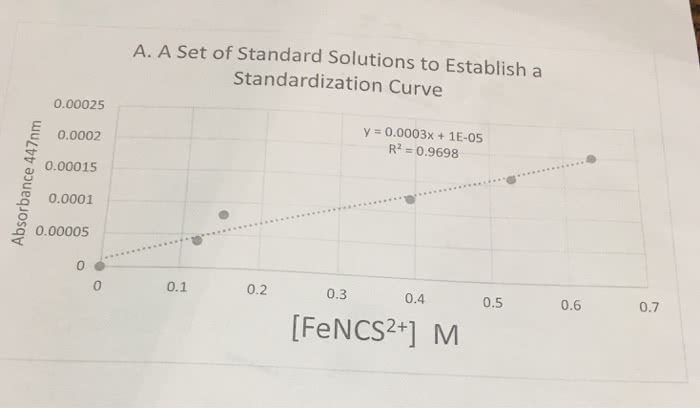
Please show graph and equation of line via Excel (question 2)
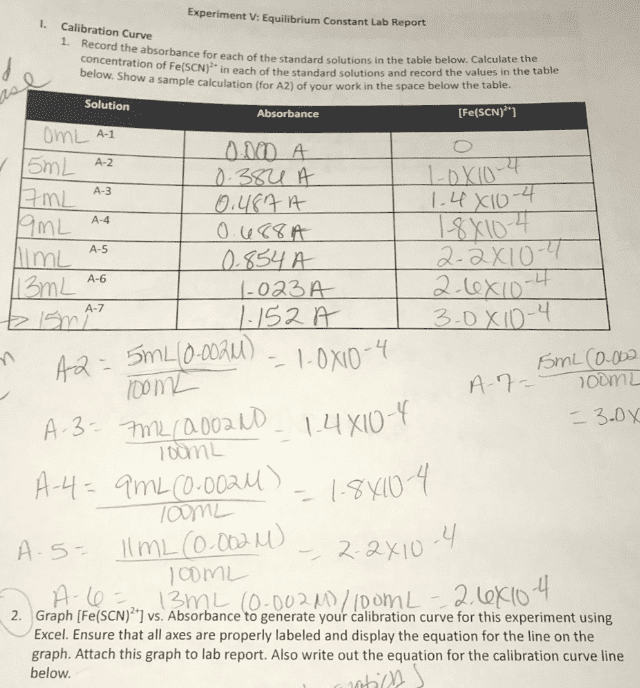
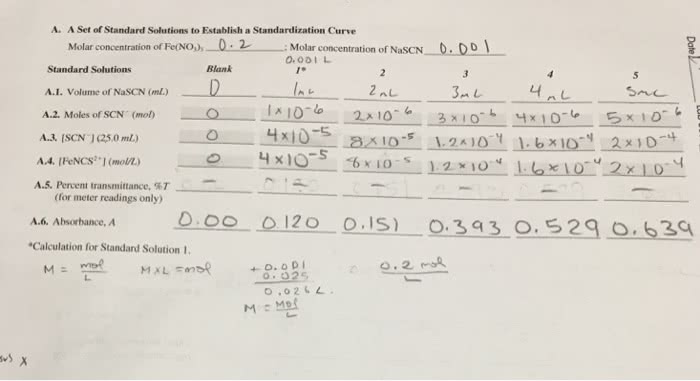
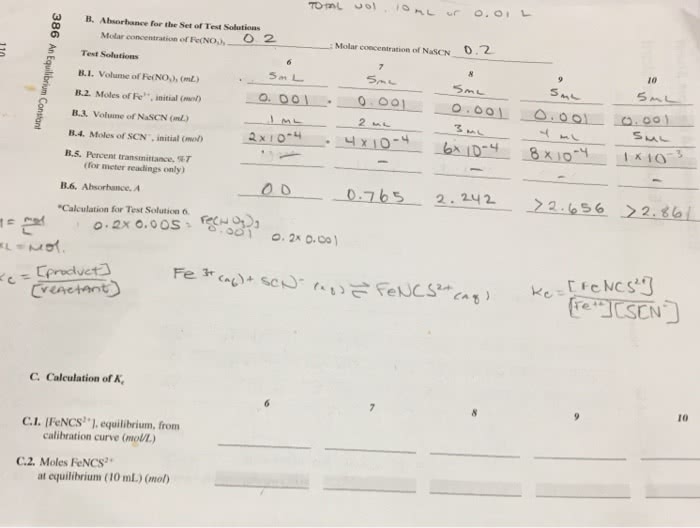
Experiment V: Equilibrium Constant Lab Report 1. Calibration Curve 1. Record the absorbance for each of the standard solutions in the table below. Calculate the below. Show a sample calculation for sorwhe h or Fe(scN] in each of the standard solutions and record the values in the table a sample calculation (for A2) of your work in the space below the table. Solution Absorbance [ Fe(SCN)2.] A-3 å 0 A-S ml A-6 033 A A-7 h8 Dom 3.0X 1.4 XI0 omL 100m com㬠2. Graph [Fe(SCN) "] vs. Absorbance to generate your calibration curve for this experiment using Excel. Ensure that all axes are properly labeled and display the equation for the line on the graph. Attach this graph to lab report. Also write out the equation for the calibration curve line below