Create graph of voltage from the chloride selective electrode versus log of concentration of the standardized and diluted standardized solutions. The graph should be failry straight, if its not then preform a linear regression.
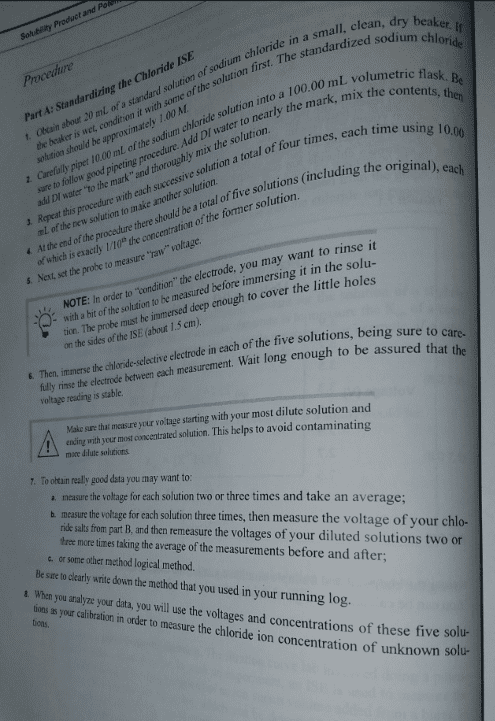
10.00 mL of sodium chloride solution was pippetted into a 100.00 mL volumetric flask. DI water was added just under the mark in the flask and it was mixed, then more DI water was added untill the mark and was mixed. We then took 10 mL of the new solution and did the same thing, and kept doing to end up with a total of 5 solutions including the original. We then took the "raw voltage" of each solution twice. Below is a table of the data and the procedure as well so you can get an idea.
Table:
1 (voltage)
2 (voltage)
3 (voltage)
4 (voltage)
5 (voltage)
1.481
1.653
1.854
2.065
2.155
1.500
1.641
1.841
2.045
2.145
NaCl concentration:
Run 1 (Voltage): 1.407
Run 2 (Voltage): 1.406
NaOH concentration (you may or may not need to use this): 0.115 M