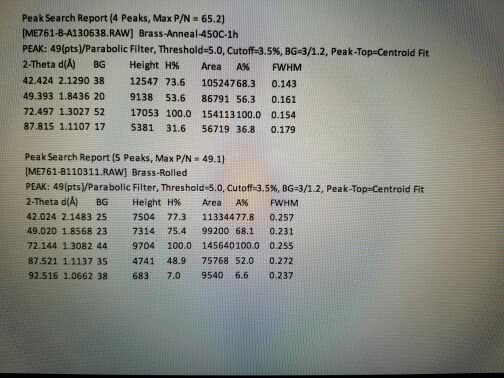
a sample of brass was run using standard XRD ((/lambda) = 1.542A) and the area-detector system ((/lambda) = 1.79A). the brass was run in the cold-rolled and annealed conditions (annealed 1h at 450 C). recall that brass is a Cu-Zn alloy with an FCC structure. the lattice constant of Cu is a = 3.615A; the lattice constant for Zn, if constructed in a FCC crystal, would be a = 3.762A. the results are shown in the photo as tables for the XRD data, at the link (https://imgur.com/gallery/g0Erc) as figures of the XRD patterns, and pole figures for the rolled sample. analyze these samples using the following processes: a) determine the grain or domain size for the rolled brass. this can be done by considering the FWHM (given in degrees 2(/theta)) for the (200) peaks, and using the FWHM for the annealed sample as the "instrumental" broadening. b) using the 2(/theta) values given for the (200) peaks, determine the residual stress in the rolled sample assunint the peak position for the annealed sample represents the true, unstressed state. for brass, E = 97 GPa and v = 0.31. c) determine the concentration of Zn in the annealed brass sample. this is to be done by using the precision lattice parameter measurement method (Bradley-Jay) the to determine lattice constant of the brass. assume the percent Zn in the alloy scales linearly with the change in lattice constant (between pure element values given above) d) calculate the values of (I_111)/((I_111)+(I_200)) for the theoretical, annealed and rolled samples and comment on the crystallographic texture in the sample. compare your results to the pole figures given from the rolled sample. (for calculations of the theoretical case, assume the sample is pure copper).