The continuous flow stirred-tank reactor (CSTR), also known as water backmix reactor, is a common ideal reactor type in chemical engineering. A CSTR often refers to a model used to estimate the key unit operation variables when using a continuous agitated- tank reactor to reach a specified output.
It is amused perfect or ideal mixing in CSTR and we are checking the concentrations and temperature along time in CSTR.
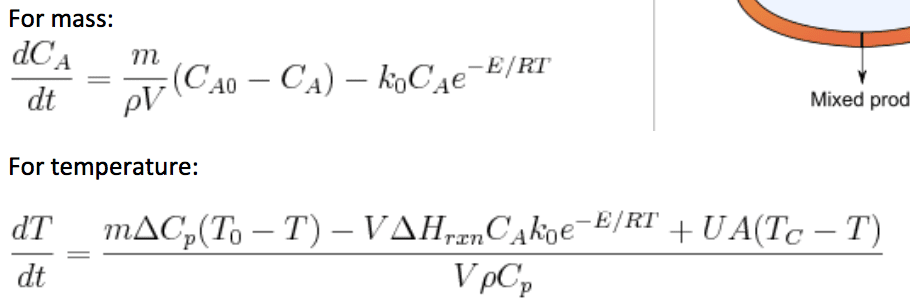
Following equations can be obtained to describe the CSTR.
Problem:
1) Show the equations you need to solve C and T from current step to next step using Eulerâs method.
2) Using time step of 1 second to show calculate the values of C and T from 0 second to 21 seconds using Eulerâs method. Plot the changes of C and T over time.
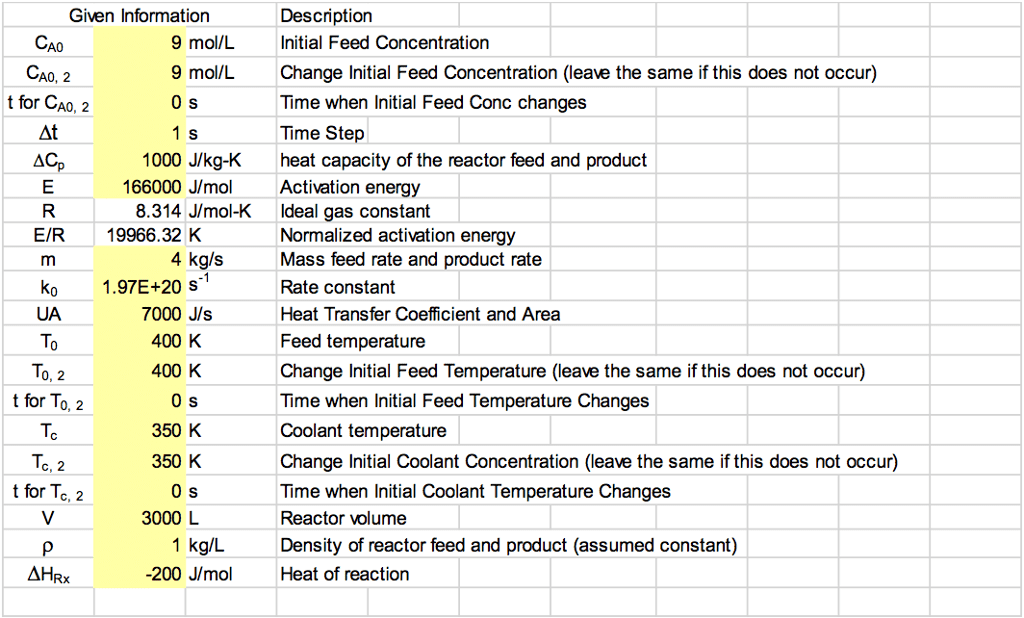
Using following given initial values and parameters.
For mass: do 772 A0 dt For temperature: dT -E/RT CA) koCAe T) V VpCp E/RT Mixed prod UA(T
A research article indicates that concentration of A should vary with time according to the following expression:
CA(t)=11CA0+kt
(1)
where CA0 (mol/L) is the initial concentration of A in the reactor [CA(t=0)] and k is called the reaction rate constant. Despite being called a constant, k is a strong function of the absolute temperature in the reactor:
k(T)=k0 expâEaRT(K)
(2)
In this equation (known as the Arrhenius equation after the Swedish chemist who proposed it), k0 is a constant, Ea(J/mol) is the reaction activation energy, and R=8.314 J/(mol·K) is the universal gas constant. Your task will be to verify that the expressions for CA(t) and k(T) fit the data, and if they do, to determine the parameters CA0 and k at each temperature and then the constants k0 and Ea.
(a)
What are the units of k, k0, and Ea if CA is in mol/L and t is in min?
(b)
Transform Equation 1 into an equation of the form y=at+b, so that if Equation 1 is valid, a plot of yvs. t would be a straight line. How would you determine CA0 and k from the slope and intercept of the line?
(c)
Create an Excel spreadsheet with the structure shown as Rows 1-10 in the figure at the end of this problem statement, and fill in the data table in Columns A-I. Then create the four scatterplots shown in Rows 15-21. In the âTrendlineâ options of each plot, check the boxes for âDisplay equation on chartâ and âDisplay R-squared value on chartâ but not the one for âSet intercept.â R2 is the coefficient of determination (it has several other names as well), and provides a measure of how well a straight line fits a set of data: the closer it is to 1, the better the fit. What can you conclude about Equation 1 from the four plots?
(d)
From the four trendline equations, calculate the values of k and CA0 for each of the four experimental temperatures and fill in Columns B-I in Rows 12 and 13 of the spreadsheet.
(e)
Enough A was initially added to the tank to make the initial concentration CA0=0.25 mol/L, yet you calculated four different values of CA0 in Part d. How do you explain this result?