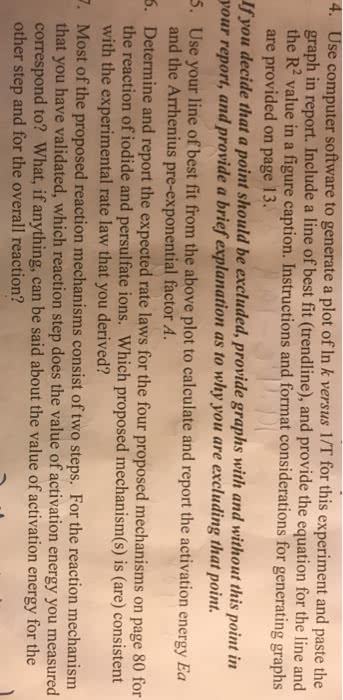
Use computer software to generate a plot of In k versus 1/T graph in repo for this experiment and paste the rt. Include a line of best fit (trendline), and provide the equation for the line and in a figure caption. Instructions and format considerations for generating graphs are provided on page 13. f you decide that a point should be excluded, provide graphs with and without this point in your report, and provide a brief explanation as to why you are excluding that point. 5. Use your line of best fit from the above plot to calculate and report the activation energy Ea 6. 2 and the Arrhenius pre-exponential factor A. Determine and report the expected rate laws for the four proposed mechanisms on page 80 for the reaction of iodide and persulfate ions. Which proposed mechanism(s) is (are) consistent with the experimental rate law that you derived? Most of the proposed reaction mechanisms consist of two steps, For the reaction mechanism that you have validated, which reaction step does the value of activation energy you measured correspond to? What, if anything, can be said about the value of activation energy for the other step and for the overall reaction? .
A research article indicates that concentration of A should vary with time according to the following expression:
CA(t)=11CA0+kt
(1)
where CA0 (mol/L) is the initial concentration of A in the reactor [CA(t=0)] and k is called the reaction rate constant. Despite being called a constant, k is a strong function of the absolute temperature in the reactor:
k(T)=k0 expâEaRT(K)
(2)
In this equation (known as the Arrhenius equation after the Swedish chemist who proposed it), k0 is a constant, Ea(J/mol) is the reaction activation energy, and R=8.314 J/(mol·K) is the universal gas constant. Your task will be to verify that the expressions for CA(t) and k(T) fit the data, and if they do, to determine the parameters CA0 and k at each temperature and then the constants k0 and Ea.
(a)
What are the units of k, k0, and Ea if CA is in mol/L and t is in min?
(b)
Transform Equation 1 into an equation of the form y=at+b, so that if Equation 1 is valid, a plot of yvs. t would be a straight line. How would you determine CA0 and k from the slope and intercept of the line?
(c)
Create an Excel spreadsheet with the structure shown as Rows 1-10 in the figure at the end of this problem statement, and fill in the data table in Columns A-I. Then create the four scatterplots shown in Rows 15-21. In the âTrendlineâ options of each plot, check the boxes for âDisplay equation on chartâ and âDisplay R-squared value on chartâ but not the one for âSet intercept.â R2 is the coefficient of determination (it has several other names as well), and provides a measure of how well a straight line fits a set of data: the closer it is to 1, the better the fit. What can you conclude about Equation 1 from the four plots?
(d)
From the four trendline equations, calculate the values of k and CA0 for each of the four experimental temperatures and fill in Columns B-I in Rows 12 and 13 of the spreadsheet.
(e)
Enough A was initially added to the tank to make the initial concentration CA0=0.25 mol/L, yet you calculated four different values of CA0 in Part d. How do you explain this result?