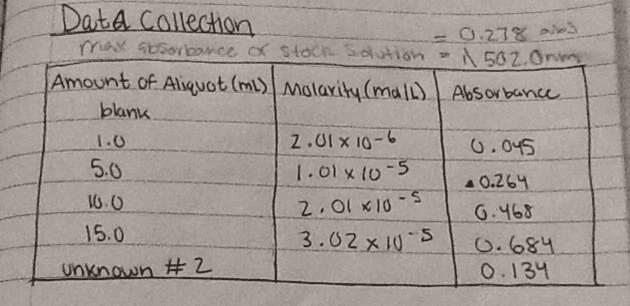
Ccalculations can be done after lab or in lab, using Excel Draw up a calibration curve, which is a plot of absorbance versus concentration for your four standard solutions and the blank. The blank has zero absorption, zero concentration and constitutes a point on the plot. An Excel plot should be suitable. If appropriate, you can get Excel to force the best-fit line to go through (0, 0). Obtain the equation of the best-fit line, i.e. the slope and the y-axis intercept, if not zero. From this equation, and the measured absorbance of the Kool-Aid solution, calculate the concentration of Allura Red in the unknown. Bearing in mind that the unknown was ten times weaker than the normal Kool-Aid drink would be, calculate the concentration of Allura Red present in the drink when made up according to the package instructions. Attach Excel table and graph Equation of the line: R-2 value: Concentration of Allura Red in your unknown: Concentration of Allura Red in normal Kool-Aid drink package: Why do we need 1-max? According to the Beer-Lambert law, the calibration curve should be perfectly linear. The amount of "scatter" in the points is a reflection of experimental error. Comment on the linearity of your data and suggest major source of errors which might reasonably account for the scatter. A student finishes with her std. soln. 1 and properly, thoroughly rinses out the 100 mL volumetric flask using distilled water. Then, however, she immediately proceeds to pipet 5 mL of stock solution into the volumetric flask without making any attempt to dry or shake out the residual water in the flask. What effect will this have on her std. soln. 5? Will the concentration be too large? Too small? Explain. Someone offers you a red-colored soft drink, but you are concerned that the coloring may not be Allura Red or that it may be from a combination of dyes. What simple lab test could you do to decide whether or not the color of the drink is due solely to Allura Red?