1
answer
0
watching
156
views
6 Nov 2019
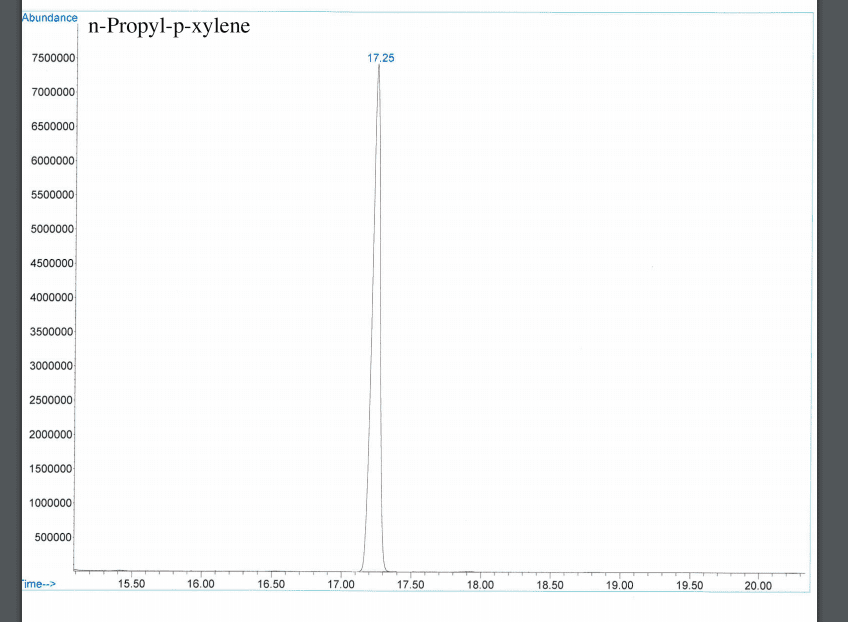
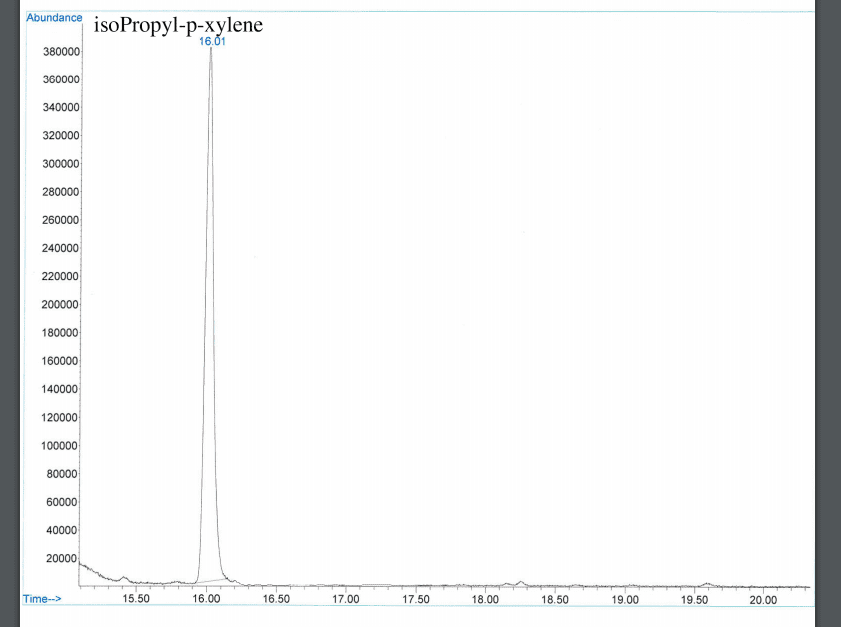
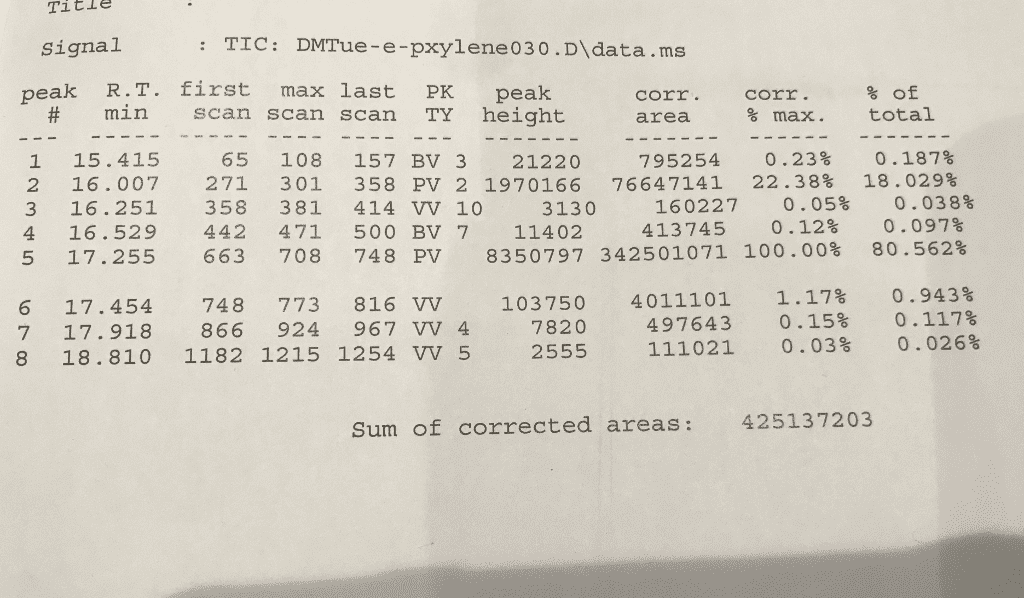
I need help on GC analysis. The first two graphs are the standards and the final picture is my data results.
Here on the instructions: If you have more than two peaks on your GC, you will need to calculate the ratio of just the two desired products. Using the standard GCâs for your unknown compounds, identify which of the peaks correspond to the two products we are analyzing. Use the corrected areas (âCorr Areaâ) on your results table. Take each individual area and divide by the total of the two areas to determine the Percent Composition of each compound.
bundance n-Propyl-p-xylene 7500000 17.25 7000000 6500000 6000000 5500000 5000000 4500000 4000000 3500000 3000000 2500000 2000000 1500000 1000000 500000 15.50 16.00 16.50 17.00 17.5018.00 18.50 19.0019.50 20.00 Abundance 16.01 380000 360000 340000 320000 300000 280000 260000 240000 220000 200000 180000 160000 140000 120000 100000 80000 60000 40000 Time--> 15.50 16.00 16.50 17.00 17.50 18.00 18.50 20.00 Title signal # min scan scan scan TY height TIC: DMTue-e-pxylene 03 0.D\data . ms : peak R.T. first max last PK peak corr. % max . %of total corr. area 1 15.415 65108157 Bv3 21220 795254 0.23% 0.187% 2 16.007 271 301 358 PV 21970166 76647141 22.38% 18.029% 316.251 358 381 414 VV 10 3130 160227 0.05% 0.038% 16.529 442 471 500 BV7 11402 413745 0.12% 0.097% 5 17.255 663 708 748 PV 8350797342501071 100.00% 80.562% 617.454 748 773 816 VV 103750 4011101 1.17% 0.943% 0.117% 0.15% 0.03% 497643 7 17.918 866 924 967 VV 4 8 18.810 1182 1215 1254 VV 5 2555 111021 7820 0.026% Sum of corrected areas: 425137203 Show transcribed image text
I need help on GC analysis. The first two graphs are the standards and the final picture is my data results.
Here on the instructions: If you have more than two peaks on your GC, you will need to calculate the ratio of just the two desired products. Using the standard GCâs for your unknown compounds, identify which of the peaks correspond to the two products we are analyzing. Use the corrected areas (âCorr Areaâ) on your results table. Take each individual area and divide by the total of the two areas to determine the Percent Composition of each compound.


bundance n-Propyl-p-xylene 7500000 17.25 7000000 6500000 6000000 5500000 5000000 4500000 4000000 3500000 3000000 2500000 2000000 1500000 1000000 500000 15.50 16.00 16.50 17.00 17.5018.00 18.50 19.0019.50 20.00
Abundance 16.01 380000 360000 340000 320000 300000 280000 260000 240000 220000 200000 180000 160000 140000 120000 100000 80000 60000 40000 Time--> 15.50 16.00 16.50 17.00 17.50 18.00 18.50 20.00
Title signal # min scan scan scan TY height TIC: DMTue-e-pxylene 03 0.D\data . ms : peak R.T. first max last PK peak corr. % max . %of total corr. area 1 15.415 65108157 Bv3 21220 795254 0.23% 0.187% 2 16.007 271 301 358 PV 21970166 76647141 22.38% 18.029% 316.251 358 381 414 VV 10 3130 160227 0.05% 0.038% 16.529 442 471 500 BV7 11402 413745 0.12% 0.097% 5 17.255 663 708 748 PV 8350797342501071 100.00% 80.562% 617.454 748 773 816 VV 103750 4011101 1.17% 0.943% 0.117% 0.15% 0.03% 497643 7 17.918 866 924 967 VV 4 8 18.810 1182 1215 1254 VV 5 2555 111021 7820 0.026% Sum of corrected areas: 425137203
Show transcribed image text 
Reid WolffLv2
18 Oct 2019

Related textbook solutions

Basic Chemistry
5 Edition,
Timberlake
ISBN: 9780134138046

Principles of Chemistry Molecular Approach
4th Edition,
Tro
ISBN: 9780134112831

Principles of Chemistry Molecular Approach
3rd Edition, 2014
Tro
ISBN: 9780321971944

Chemistry: Structure and Properties
2nd Edition,
Tro
ISBN: 9780134293936

Chemistry: A Molecular Approach
3rd Edition,
Tro
ISBN: 9780321809247

Chemistry: A Molecular Approach
5th Edition,
Tro
ISBN: 9780134874371

Principles of Chemistry: A Molecular Approach
4th Edition,
Tro
ISBN: 9780134895741

Chemistry: The Central Science
14th Edition, 2017
Brown
ISBN: 9780134414232