follow the instructions on the picture. please answercompletely.
Molecular absorption spectroscopy yielded the melatonin concentrations in the table below The data in the table was fitted with linear least squares regression The regression model is A = 0.0863(plusminus0.0040) + 0.0701(plusminus0.0007)cm where A is the absorbance and cM Is the melatonin concentration The errors in the model are expressed as one standard deviation in the parameter, What are the calibration sensitivity and analytical sensitivity of the analysis? What is the blank signal? What is the detection limit of the method What is the highest probability that a signal detections limit is generated from the statistical fluctuation of blank signal? The total probability between 3 standard deviations and +3 standard deviations is 0.99730.
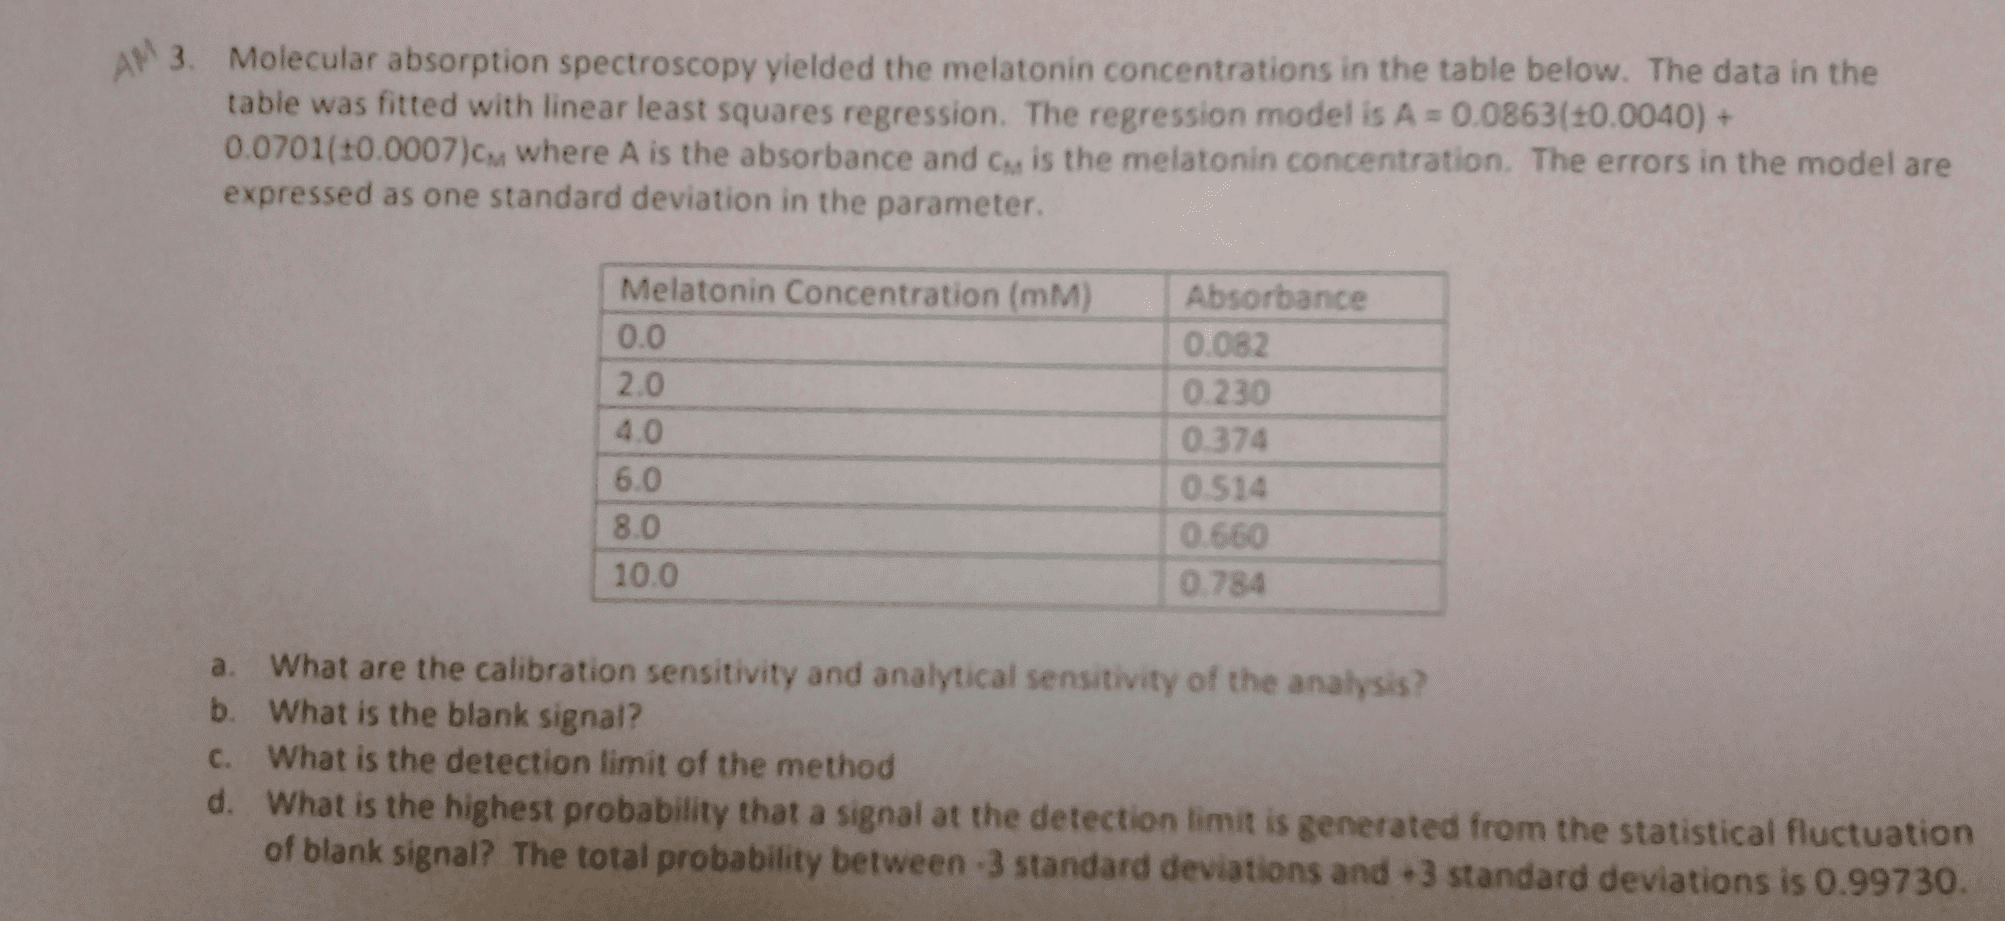
Show transcribed image textMolecular absorption spectroscopy yielded the melatonin concentrations in the table below The data in the table was fitted with linear least squares regression The regression model is A = 0.0863(plusminus0.0040) + 0.0701(plusminus0.0007)cm where A is the absorbance and cM Is the melatonin concentration The errors in the model are expressed as one standard deviation in the parameter, What are the calibration sensitivity and analytical sensitivity of the analysis? What is the blank signal? What is the detection limit of the method What is the highest probability that a signal detections limit is generated from the statistical fluctuation of blank signal? The total probability between 3 standard deviations and +3 standard deviations is 0.99730.
First, make a calibration curve using only the area of the ethanol peak and the concentrations of the standards. As in Part 1 a and b, prepare and print a calibration curve including the linear least squares equation of the line equation and the R2 value, and print a copy for your report. Also, calculate the concentration of your sample and the uncertainty (95% confidence interval), as well as the uncertainty of the unknown determination on a percentage basis, and include these values in your report. .
Next, make a calibration curve based on the ratio of ethanol area to propanol area and the concentrations of the standards. As in the previous question, prepare and print a calibration curve including the linear least squares equation of the line equation and the R2 value, and print a copy for your report. Also, calculate the concentration of your sample and the uncertainty (95% confidence interval), as well as the uncertainty of the unknown determination on a percentage basis, and include these values in your report. .
At a blood alcohol concentration of 0.08% (w/v) or more a person is considered impaired. Briefly discuss whether the calculated results for the sample in e and f above support criminal charges of impairment.
Report Requirements:
Spreadsheet with graphs and calculations. Prepare separate sheets in one excel file for each of the following:
Data Set 1
Data Set 2
Calibration with external standard
Standard addition with one standard (optional, could submit hand or type written calculation only)
Standard addition with multiple additions
Internal standard peak areas
Internal standard peak area ratios
Print-outs of graphs
Data Set 1
Data Set 2
Calibration with external standard
Standard addition with multiple additions
Internal standard peak areas
Internal standard peak area ratios
Results
Fill in the table below with results from the spreadsheet. Remember to include units.