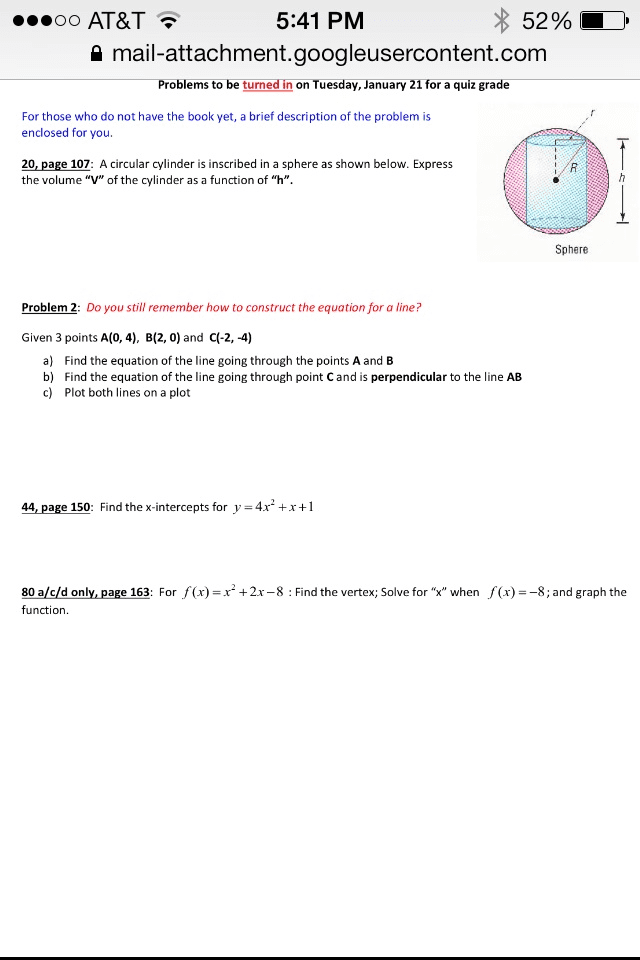
For those who do not have the book yet, a brief description of the problem is enclosed for you. A circular cylinder is inscribed in a sphere as shown below. Express the volume "V" of the cylinder as a function of "h". Do you still remember how to construct the equation for a line? Given 3 points A(0, 4), B(2, 0) and C(-2, -4) Find the equation of the line going through the points A and B Find the equation of the line going through point C and is perpendicular to the line AB Plot both lines on a plot Find the x-intercepts for y = 4x2 + x + 1 For f(x) = x2 + 2x -8 : Find the vertex; Solve for "x" when f(x) = -8; and graph the function.
Show transcribed image textFor those who do not have the book yet, a brief description of the problem is enclosed for you. A circular cylinder is inscribed in a sphere as shown below. Express the volume "V" of the cylinder as a function of "h". Do you still remember how to construct the equation for a line? Given 3 points A(0, 4), B(2, 0) and C(-2, -4) Find the equation of the line going through the points A and B Find the equation of the line going through point C and is perpendicular to the line AB Plot both lines on a plot Find the x-intercepts for y = 4x2 + x + 1 For f(x) = x2 + 2x -8 : Find the vertex; Solve for "x" when f(x) = -8; and graph the function.
A research article indicates that concentration of A should vary with time according to the following expression:
CA(t)=11CA0+kt
(1)
where CA0 (mol/L) is the initial concentration of A in the reactor [CA(t=0)] and k is called the reaction rate constant. Despite being called a constant, k is a strong function of the absolute temperature in the reactor:
k(T)=k0 expâEaRT(K)
(2)
In this equation (known as the Arrhenius equation after the Swedish chemist who proposed it), k0 is a constant, Ea(J/mol) is the reaction activation energy, and R=8.314 J/(mol·K) is the universal gas constant. Your task will be to verify that the expressions for CA(t) and k(T) fit the data, and if they do, to determine the parameters CA0 and k at each temperature and then the constants k0 and Ea.
(a)
What are the units of k, k0, and Ea if CA is in mol/L and t is in min?
(b)
Transform Equation 1 into an equation of the form y=at+b, so that if Equation 1 is valid, a plot of yvs. t would be a straight line. How would you determine CA0 and k from the slope and intercept of the line?
(c)
Create an Excel spreadsheet with the structure shown as Rows 1-10 in the figure at the end of this problem statement, and fill in the data table in Columns A-I. Then create the four scatterplots shown in Rows 15-21. In the âTrendlineâ options of each plot, check the boxes for âDisplay equation on chartâ and âDisplay R-squared value on chartâ but not the one for âSet intercept.â R2 is the coefficient of determination (it has several other names as well), and provides a measure of how well a straight line fits a set of data: the closer it is to 1, the better the fit. What can you conclude about Equation 1 from the four plots?
(d)
From the four trendline equations, calculate the values of k and CA0 for each of the four experimental temperatures and fill in Columns B-I in Rows 12 and 13 of the spreadsheet.
(e)
Enough A was initially added to the tank to make the initial concentration CA0=0.25 mol/L, yet you calculated four different values of CA0 in Part d. How do you explain this result?