1
answer
0
watching
312
views
11 Jun 2020
HOW DO YOU SEE IT? Use the graphs of f and g shown in the figures to answer the following.
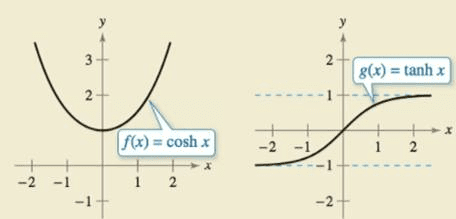
(a) Identify the open interval(s) on which the graphs of f and g are increasing or decreasing.
(b) Identify the open interval(s) on which the graphs of f and g are concave upward or concave downward.
HOW DO YOU SEE IT? Use the graphs of f and g shown in the figures to answer the following.

(a) Identify the open interval(s) on which the graphs of f and g are increasing or decreasing.
(b) Identify the open interval(s) on which the graphs of f and g are concave upward or concave downward.

Joram GuingguingLv10
13 Sep 2020


