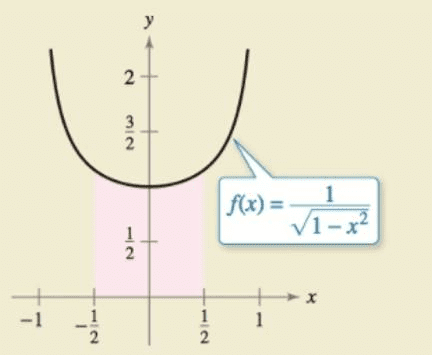
HOW DO YOU SEE IT? Using the graph, which value best approximates the area of the region between the x-axis and the function over the interval Explain.
(a)
(b)
(c) 1
(d) 2
(e) 4
For unlimited access to Homework Help, a Homework+ subscription is required.
EXPLORING CONCEPTS
Approximation In Exercises 79 and 80, determine which value best approximates the area of the region between the x-axis and the graph of the function over the given interval. Make your selection on the basis of a sketch of the region, not by performing calculations.
(a). 3 (b).7 (c). –2 (d). 5 (e). 1
Approximation In Exercises 87 and 88, determine which value best approximates the area of the region between the -axis and the graph of the function over the given interval. Make your selection on the basic of a sketch of the region, not by performing calculations.
(c)
(d)
(e)