1
answer
0
watching
158
views
11 Jun 2020

HOW DO YOU SEE IT?


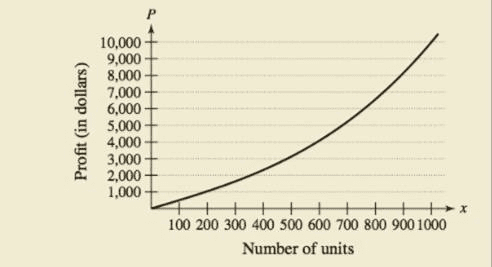
The graph shows the profit P (in dollars) from selling x units of an item. Use the graph to determine which is greater, the change in profit when the production level changes from 400 to 401 units or the change in profit when the production level changes from 900 to 901 units. Explain your reasoning.

Chapter 3.9, Problem 38E, HOW DO YOU SEE IT? The graph shows the profit P (in dollars) from selling x units of an item. Use

For unlimited access to Homework Help, a Homework+ subscription is required.

Rico Jay Laxa
Rico Jay LaxaLv10
30 Jun 2020

Unlock all answers

Get 1 free homework help answer.
Already have an account? Log in

Related textbook solutions

Related questions

Weekly leaderboard

Start filling in the gaps now
Log in