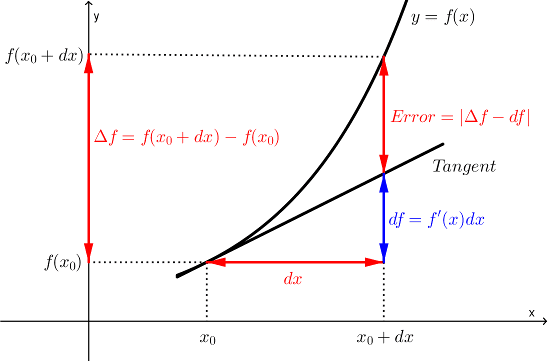
The figure shows how a function f(x) and its linear approximation (i.e., its tangent line) change value when x changes from x0 to x0+dx. Suppose f(x)=x2+4x, x0=2 and dx=0.04. Your answers below need to be very precise, so use many decimal places.
(a) Find the change Îf=f(x0+dx)âf(x0)). Îf =
(b) Find the estimate (i.e., the differential) df=fâ²(x0)dx. df =
(c) Find the approximation error |Îfâdf| Error =