What is happening when the constant 'a' is increased?
How do you find the domain, period and phase shift of this type of trig function?
Thanks
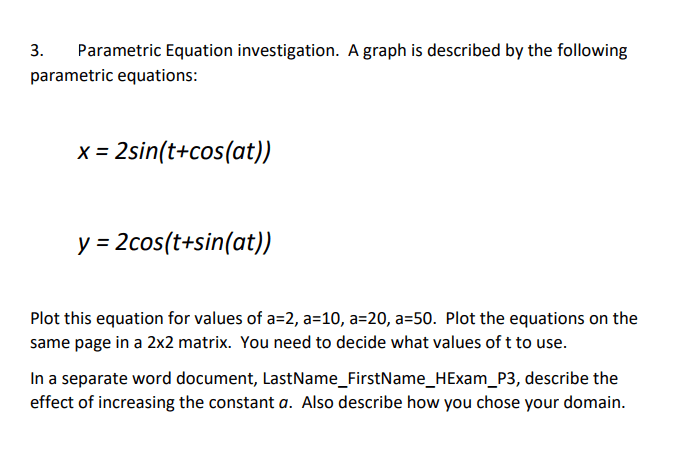
3. Parametric Equation investigation. A graph is described by the following parametric equations x = 2sin(t+cos(at)) y 2cos(t+sin(at)) Plot this equation for values of a-2, a-10, a-20, a=50. Plot the equations on the same page in a 2x2 matrix. You need to decide what values of t to use. In a separate word document, LastName_FirstName_HExam_P3, describe the effect of increasing the constant a. Also describe how you chose your domain.