1
answer
0
watching
648
views
13 Nov 2019
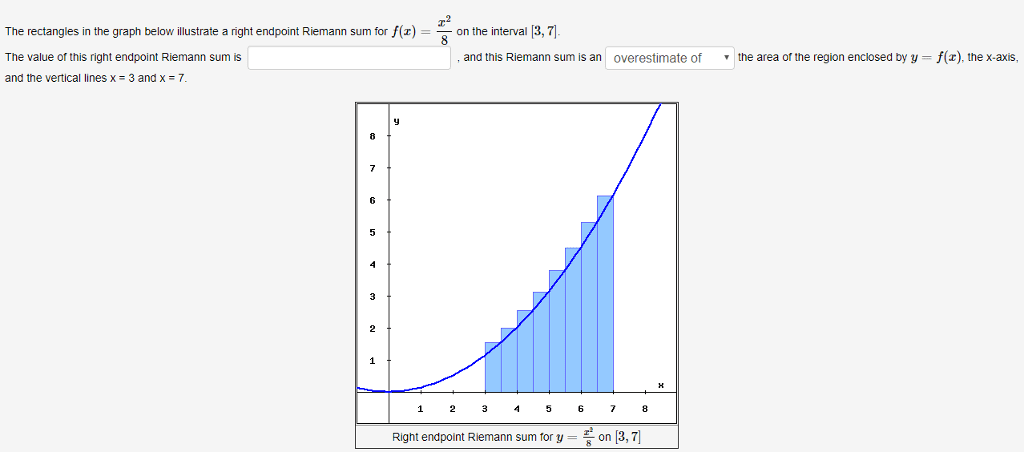
The rectangles in the graph below illustrate a right endpoint Riemann sum for f(x)on the interval [3, 7 The value of this right endpoint Riemann sum is and the vertical lines x 3 and x - 7. and this Riemann sum is an overestimate of the area or the region enclosed by y-f(z), the x-axis â¼ Right endpoint Riemann sum toron 13,7]
Tod ThielLv2
29 Jun 2019