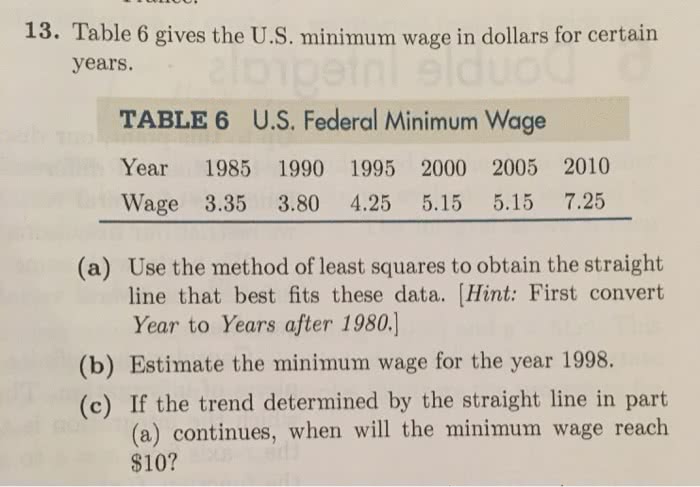
13. Table 6 gives the U.S. minimum wage in dollars for certairn years. TABLE 6 U.S. Federal Minimum Wage Year 1985 1990 1995 2000 2005 2010 Wage 3.35 3.80 4.25 5.15 5.15 7.25 Use the method of least squares to obtain the straight line that best fits these data. Hint: First convert Year to Years after 1980.] (a) (b) Estimate the minimum wage for the year 1998 (c) If the trend determined by the straight line in part (a) continues, when will the minimum wage reach $10?