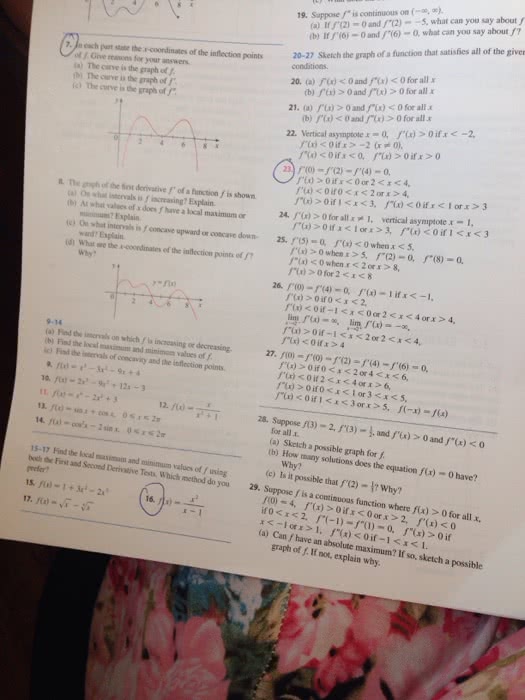
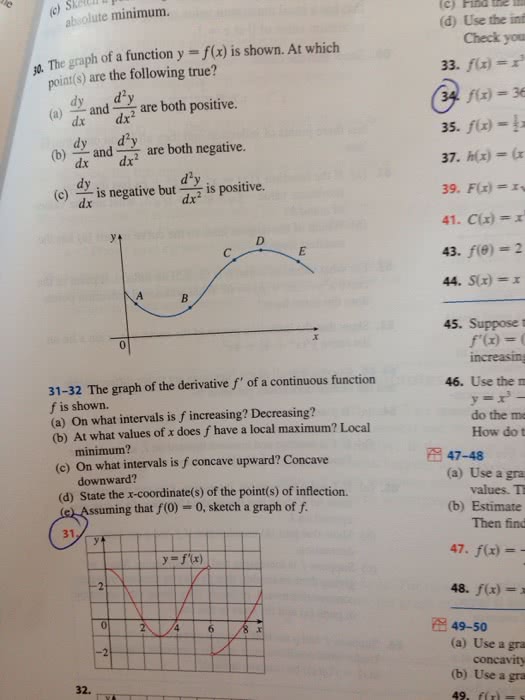
Can you help me with some of the graphs, just to know how to do the rest? Thank you.
In each of the following situations, sketch the graph of a function f(t) that has the indicated properties. f(c) is increasing f(t)>0 r(t) is increasing f(e)>o f(t) is decreasing s" (t)>o f(t) is increasing s"(t) 0 f(t) o f(e) 0 f (t) is increasing f(t) >0 f"(t) >0 r(t) is increasing f(t) is decreasing f(t) f(t) is decreasing f"(t) is decreasing f(t) o (t) is increasing s"(t) o f(e) > o f(t) 0 (t) >0 f(e) 0 f(t) s o