🏷️ LIMITED TIME OFFER: GET 20% OFF GRADE+ YEARLY SUBSCRIPTION →
Pricing
Log in
Sign up
Home
Homework Help
Study Guides
Class Notes
Textbook Notes
Textbook Solutions
Booster Classes
Blog
Calculus
1
answer
0
watching
110
views
10 Nov 2019
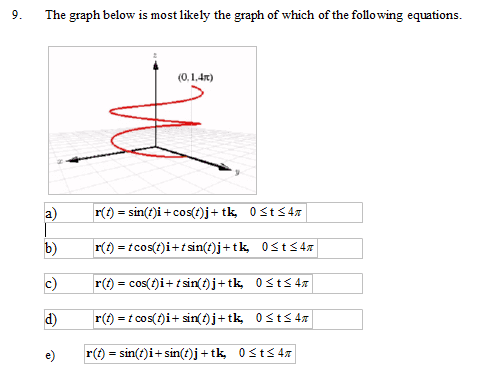
Why is the answer A?
The graph below is most likely the graph of which of the following equations. r(t) = sin(t)i + cos(t)j + tk, 0 t 4pi r(t) = t cos(t)i + t sin(t)j + tk, 0 t 4pi r(t) = cos(t)i + t sin(t)j + tk, 0 t 4pi r(t) = t cos(t)i + sin(t)j + tk, 0 t 4pi
For unlimited access to Homework Help, a
Homework+
subscription is required.
You have
0
free answers left.
Get unlimited access to
3.8 million
step-by-step answers.
Get unlimited access
Already have an account?
Log in
Collen Von
Lv2
3 Sep 2019
Unlock all answers
Get
1
free homework help answer.
Unlock
Already have an account?
Log in
Ask a question
Related textbook solutions
Calculus
4 Edition,
Rogawski
ISBN: 9781319050733
Single Variable Calculus: Early Transcendentals
4th Edition, 2018
Stewart
ISBN: 9781337687805
CALCULUS:EARLY TRANSCENDENTALS
4 Edition,
Rogawski
ISBN: 9781319050740
Weekly leaderboard
Home
Homework Help
3,900,000
Calculus
630,000
Start filling in the gaps now
Log in
New to OneClass?
Sign up
Back to top