How do you solve this problem? An explanation would bewonderful! Thanks in advance.
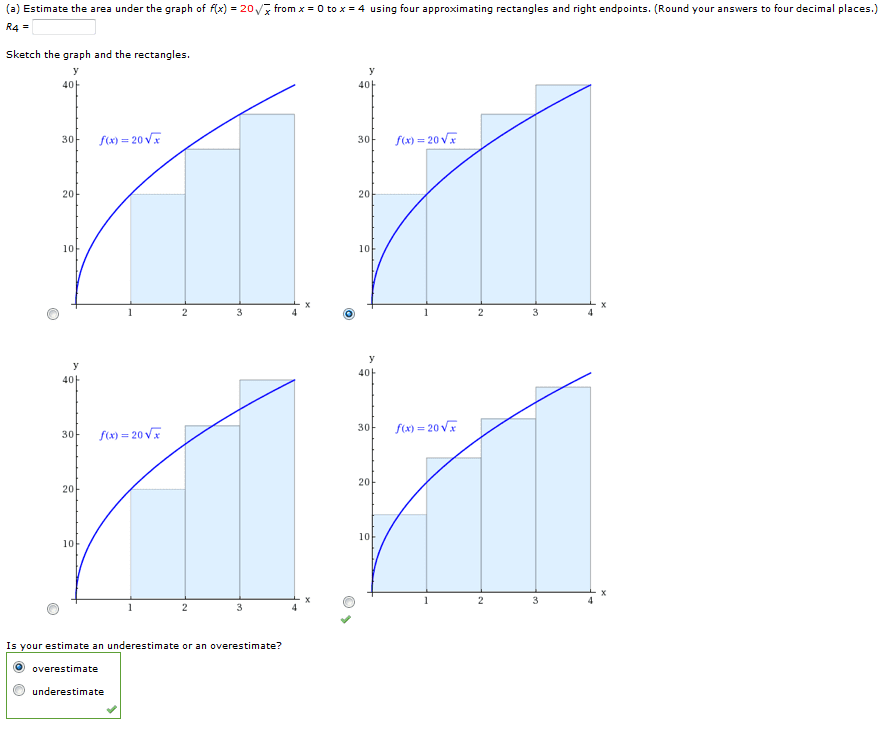
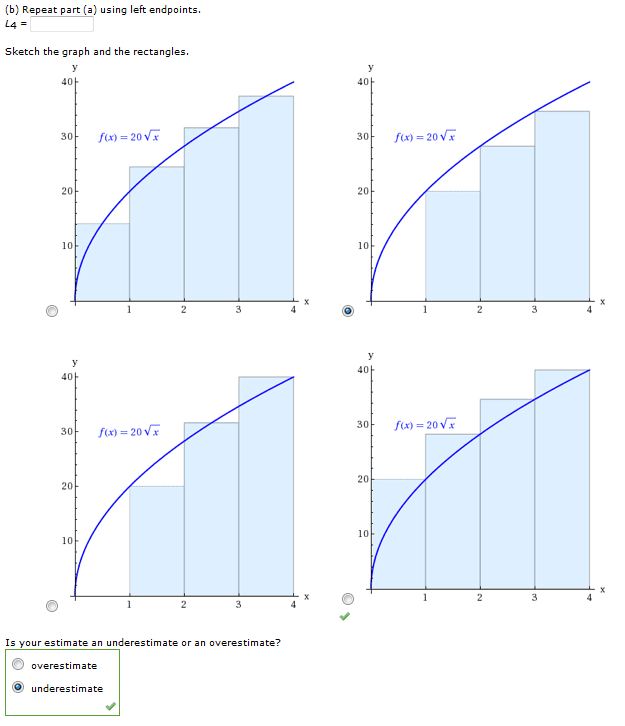
Estimate the area under the graph of f(x) = 20 from x = 0 to x =4 using four approximating rectangles and right endpoints. (Round your answers to four decimal places.) Sketch the graph and the rectangles. Is your estimate an underestimate or an overestimate? overestimate underestimate Repeat part (a) using left endpoints.L4 = Sketch the graph and the rectangles. Is your estimate an underestimate or an overestimate? overestimate underestimate