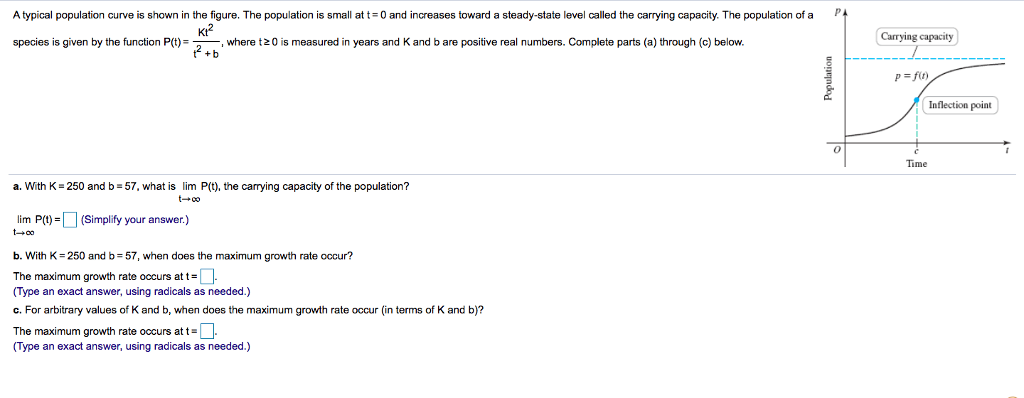
A typical population curve is shown in the figure. The population is small at t 0 and increases toward a steady-state level called the carrying capacity. The population of a P K12 Carrying capacity species is given by the function P(t)where t20 is measured in years and K and b are positive real numbers. Complete parts (a) through (c) below. +b P ft) Inflection point 0 Time a. With K-250 and b- 57, what is lim P(t), the carrying capacity of the population? lim P()(Simplify your answer.) +00 b. With K-250 and b-57, when does the maximum growth rate occur? The maximum growth rate occurs at t- (Type an exact answer, using radicals as needed.) c. For arbitrary values of K and b, when does the maximum growth rate occur (in terms of K and b)? The maximum growth rate occurs at t- (Type an exact answer, using radicals as needed.)
Show transcribed image textA typical population curve is shown in the figure. The population is small at t 0 and increases toward a steady-state level called the carrying capacity. The population of a P K12 Carrying capacity species is given by the function P(t)where t20 is measured in years and K and b are positive real numbers. Complete parts (a) through (c) below. +b P ft) Inflection point 0 Time a. With K-250 and b- 57, what is lim P(t), the carrying capacity of the population? lim P()(Simplify your answer.) +00 b. With K-250 and b-57, when does the maximum growth rate occur? The maximum growth rate occurs at t- (Type an exact answer, using radicals as needed.) c. For arbitrary values of K and b, when does the maximum growth rate occur (in terms of K and b)? The maximum growth rate occurs at t- (Type an exact answer, using radicals as needed.)