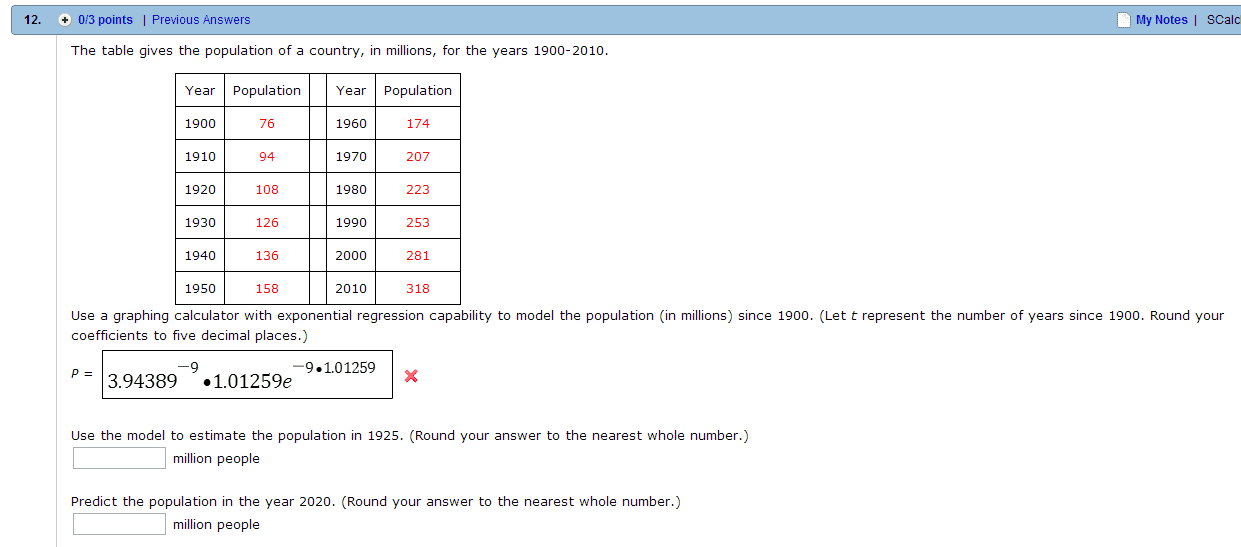
The table gives the population of a country, in millions, for the years 1900-2010. Use a graphing calculator with exponential regression capability to model the population (in millions) since 1900. (Let t represent the number of years since 1900. Round your coefficients to five decimal places.) P = Use the model to estimate the population in 1925. (Round your answer to the nearest whole number.) million people Predict the population in the year 2020. (Round your answer to the nearest whole number.) million people
Show transcribed image textThe table gives the population of a country, in millions, for the years 1900-2010. Use a graphing calculator with exponential regression capability to model the population (in millions) since 1900. (Let t represent the number of years since 1900. Round your coefficients to five decimal places.) P = Use the model to estimate the population in 1925. (Round your answer to the nearest whole number.) million people Predict the population in the year 2020. (Round your answer to the nearest whole number.) million people