1
answer
0
watching
191
views
12 Nov 2019
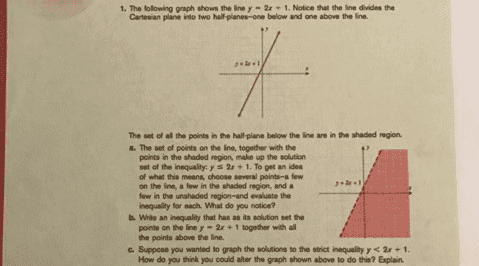
The following graph shows the line y = 2x + 1. Notice that the line divides the Cartesian plane into two half-planes-one below and one above the line. The set of all the points in the half-plane below the line are in the shaded region The set of points on the line, together with the points in the shaded region, make up the solution set of the inequality: y lessthanorequalto 2x + 1. To get an idea of what this means, choose several points-a few on the line, a few in the shaded region, and a few in the unshaded region-and evaluate the inequality for each. What do you notice? Write an inequality that has as its solution set the points on the line y = 2x + 1 together with all the points above the line. Suppose you wanted to graph the solutions to the strict inequality y
Tod ThielLv2
22 Jul 2019