1
answer
0
watching
140
views
10 Nov 2019
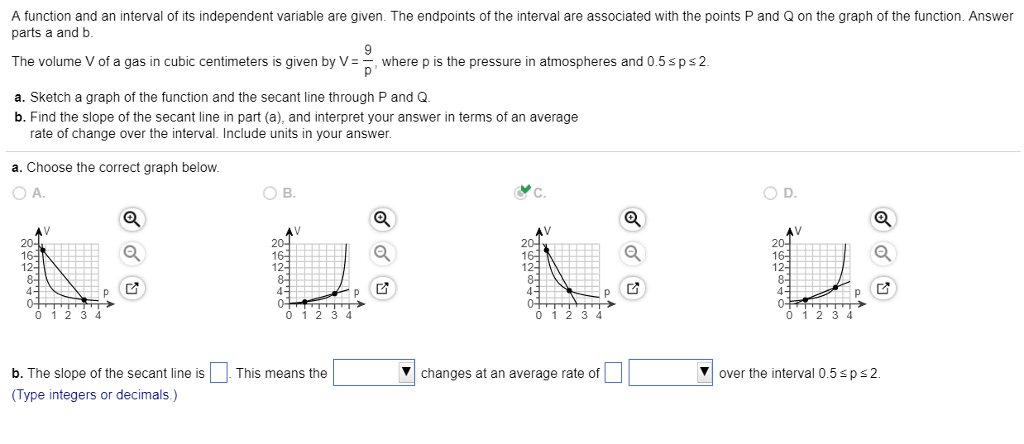
A function and an interval of its independent variable are given. The endpoints of the interval are associated with the points P and Q on the graph of the function. Answer parts a and b The volume V of a gas in cubic centimeters is given by Vwhere p is the pressure in atmospheres and 0.5 sps2 a. Sketch a graph of the function and the secant line through P and Q b. Find the slope of the secant line in part (a), and interpret your answer in terms of an average rate of change over the interval. Include units in your answer a. Choose the correct graph below O A. 12 12 12 0 1 2 3 4 0 1 2 3 4 0 12 3 4 0 1 2 3 4 Vover the interval 0.5sps2 b. The slope of the secant line is . This means the (Type integers or decimals.) changes at an average rate of
Nestor RutherfordLv2
30 Mar 2019