1
answer
0
watching
684
views
10 Nov 2019
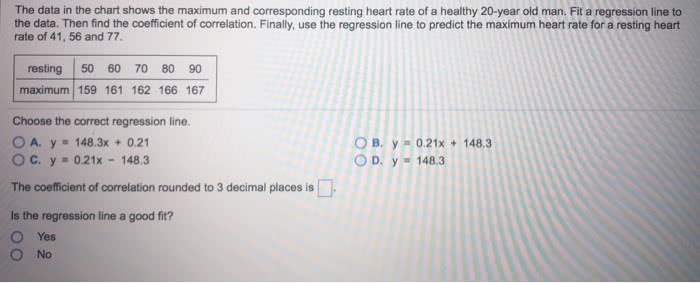
The data in the chart shows the maximum and corresponding resting heart rate of a healthy 20-year old man. Fit a regression line to the data. Then find the coefficient of correlation. Finally, use the regression line to predict the maximum heart rate for a resting heart rate of 41, 56 and 77 resting 50 60 70 80 90 maximum 159 161 162 166 167 Choose the correct regression line. O A y 148.3x+0.21 OC. y 0.21x-148.3 OB. y-0.21x + 148.3 D. y 148.3 The coefficient of correlation rounded to 3 decimal places is Is the regression line a good fit? O Yes No
Casey DurganLv2
18 Jul 2019