a.Write a function that models the difference between the female U.S.population and the male U.S. population for the years shown in thebar graph. b.Use the function from part (a) to find how many more women than menthere were in the U.S. population in 2005. c.Does the result in part (b) overestimate or underestimate theactual difference between the female and male population in 2005shown by the bar graph? By how much?
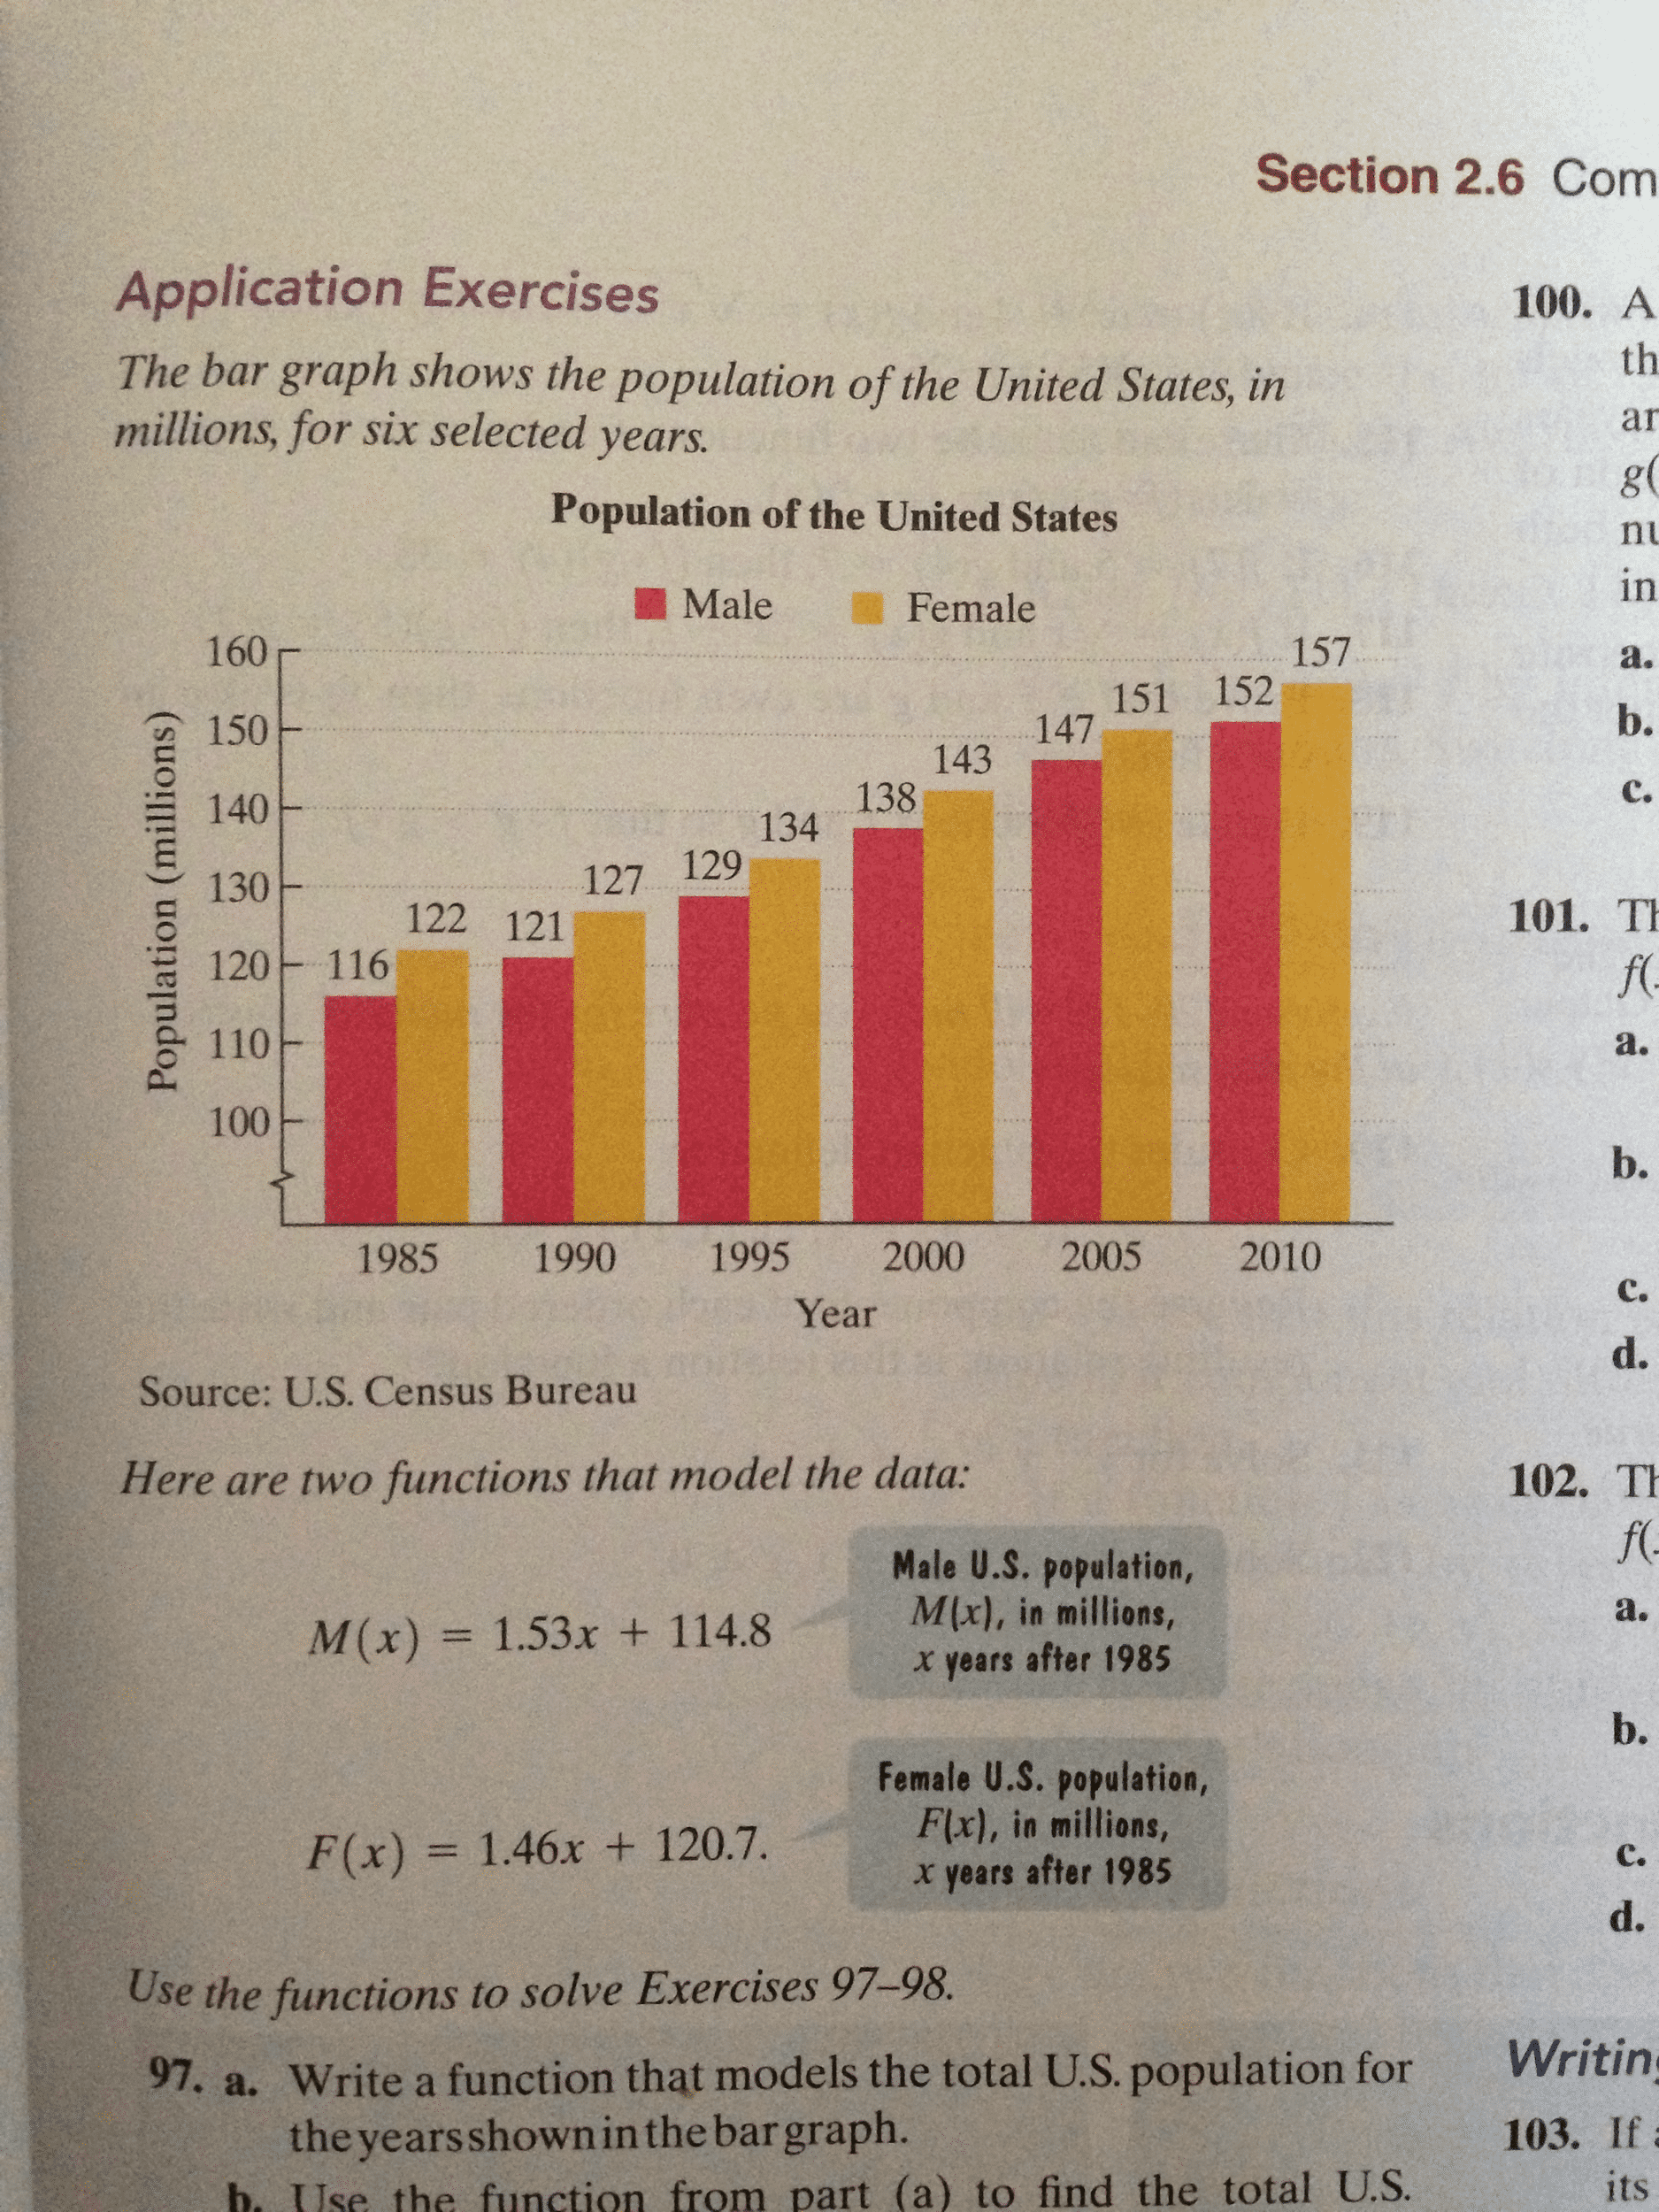
The bar graph shows the population of the United States, in millions, for six selected years. Here are two functions that model the data: M (x) = 1.53x + 114.8 F (x) = 1.46x + 120.7 Use the functions to solve Exercises 97-98. Write a function that models the total U.S. population for the years shown in the bar graph. Use the function from part (a) to find the total U.S.
Show transcribed image textThe bar graph shows the population of the United States, in millions, for six selected years. Here are two functions that model the data: M (x) = 1.53x + 114.8 F (x) = 1.46x + 120.7 Use the functions to solve Exercises 97-98. Write a function that models the total U.S. population for the years shown in the bar graph. Use the function from part (a) to find the total U.S.