PSY-380 Lecture Notes - Central Tendency, Frequency Distribution, Line Graph

Document Summary
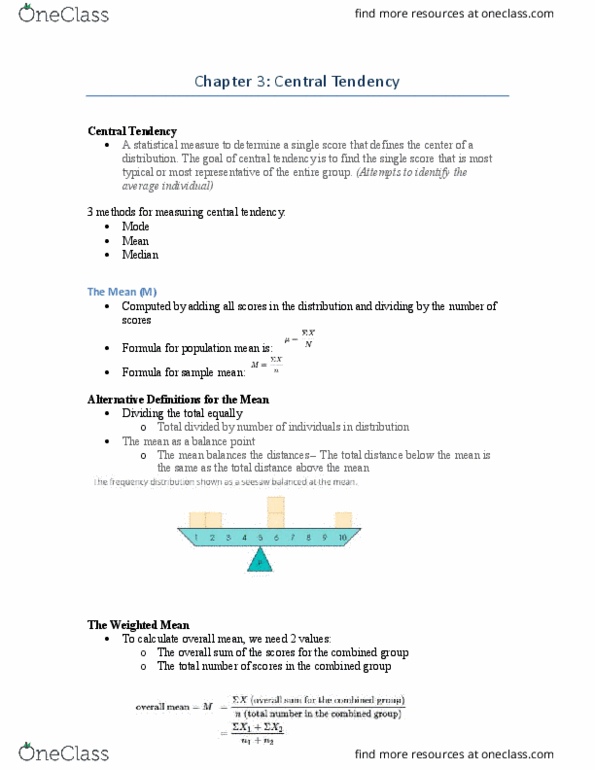
Mean: sum of the scores divided by the number of scores. Population mean: formula wherein all scores in the population are added and then divided by n. The sample mean: formula with symbols to simplify population subset values. Weighted mean: formula combining multiple sets of scores and dividing to find the overall mean for the combined group. Central tendency: statistical measure to determine a single score that defines the midpoint of a distribution. Median: midpoint in a list of scores listed in order from smallest to largest. Mode: score or category that has the greatest frequency distribution. Bimodal: distribution with two scores with the greatest frequency. Multimodal: a distribution with more than two scores with greatest frequency. Major mode: taller peak when score with greatest frequency have unequal frequencies. When two scores greatest frequency have unequal frequencies. Line graph: diagram used when values on horizontal axis are measured on an interval or ratio scale.