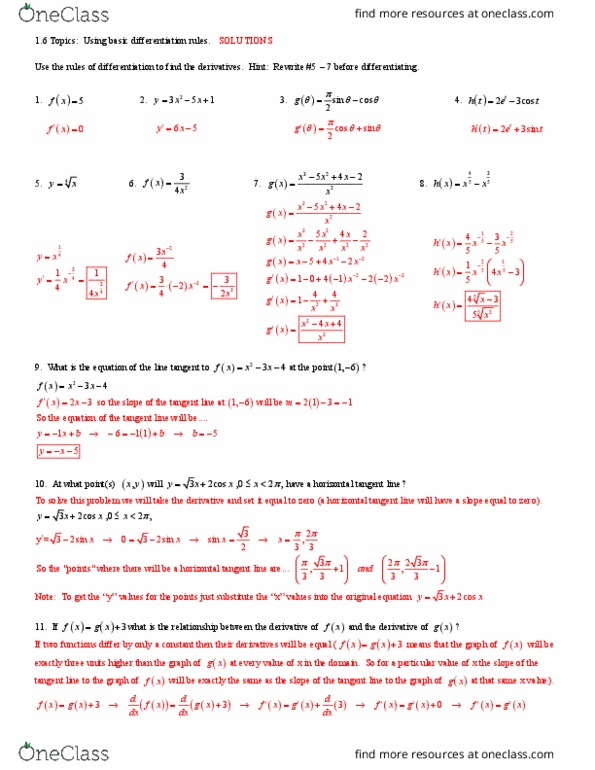
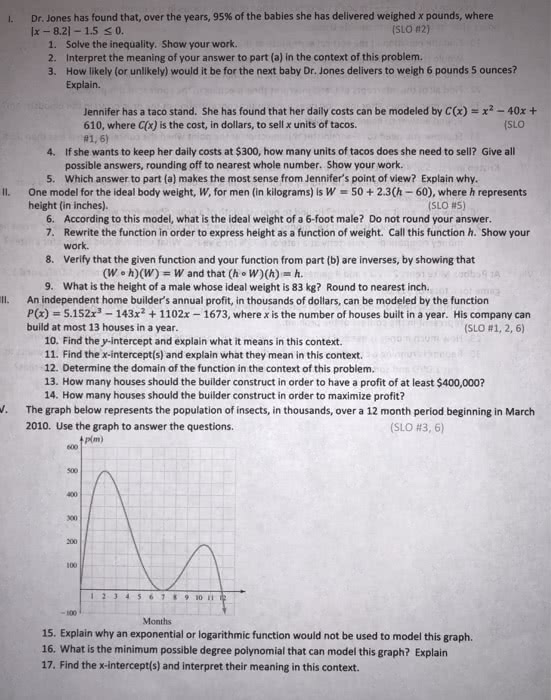
Dr. Jones has found that, over the years, 95% of the babies she has delivered weighed x pounds, where x-8.2]- 1.5 s0. " (SLO #2) 1. Solve the inequality. Show your work. 2. Interpret the meaning of your answer to part (a) in the context of this problem. 3. How likely (or unlikely) would it be for the next baby Dr. Jones delivers to weigh 6 pounds 5 ounces? Explain. Jennifer has a taco stand. She has found that her daily costs can be modeled by C(x)x2-40x + LO 610, where C(x) is the cost, in dollars, to sell x units of tacos. #1,6) (S 4. If she wants to keep her daily costs at $300, how many units of tacos does she need to sell? Give all possible answers, rounding off to nearest whole number. Show your work. 5. Which answer to part (a) makes the most sense from Jennifer's point of view? Explain why One model for the ideal body weight, W, for men (in kilograms) is W = 50 + 2.3(-60), where h represents height (in inches). ll. (SLO #5) 6. According to this model, what is the ideal weight of a 6-foot male? Do not round your answer. 7. Rewrite the function in order to express height as a function of weight. Call this function h. Show your work 8. Verify that the given function and your function from part (b) are inverses, by showing that (Wãh)(W) = W and that (h» W)(h) = h. What is the height of a male whose ideal weight is 83 kg? Round to nearest inch. II. An independent home builder's annual profit, in thousands of dollars, can be modeled by the function 9. P(x) 5-152x3-143x2 + 1102x-1673, where x is the number of houses built in a year. His company can build at most 13 houses in a year. (SLO #1, 2, 6) 10. Find the y-intercept and explain what it means in this context. 11. Find the x-intercept(s) and explain what they mean in this context 12. Determine the domain of the function in the context of this problem. 13. How many houses should the builder construct in order to have a profit of at least $400,000? 14. How many houses should the builder construct in order to maximize profit? . The graph below represents the population of insects, in thousands, over a 12 month period beginning in March 2010. Use the graph to answer the questions. (SLO #3, 6) plm) 400 200 100 1234567 9 10 I 100 Months 15. Explain why an exponential or logarithmic function would not be used to model this graph. 16. What is the minimum possible degree polynomial that can model this graph? Explain 17. Find the x-intercept(s) and interpret their meaning in this context.