L33 Psych 100B Lecture Notes - Lecture 2: Scatter Plot, Descriptive Statistics, Dependent And Independent Variables

12 Dec 2018
School
Department
Course
Professor
Document Summary
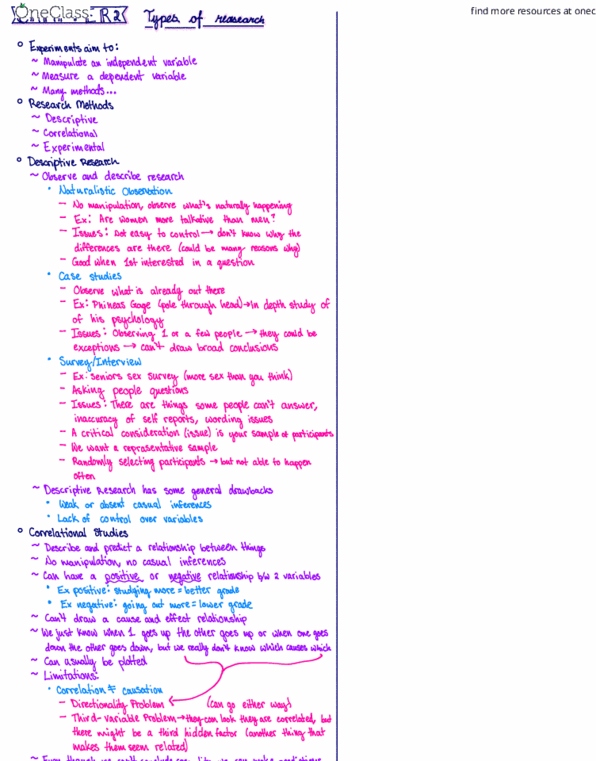
Goal: to observe and describe behavior, not predicting anything. Naturalistic observation: no manipulations, observe surroundings (ex. are women more talkative than men), no cause/effect statements, provides only surface information. Case studies: a study of unique individuals who display unique characteristics, an in- depth study of one person (can"t always draw broad conclusions) Survey/interview: you can"t ask explicit questions, possible inaccuracy of self-reporting. Goal: to describe and predict how variables are naturally related in the real world, no manipulation of the experiment. Positive: one variable increases and the other variable increases as well (ex. more studying, better exam grades) Negative: one variable increases and the other variable decreases (ex, more partying, worse exam grades) Unhappy people may spend less time on social media. Quantitative expression of strength of relationship between two variables. Can be positive relationship or negative (positive 1 to negative 1) Perfect correlation: when the correlation reaches 1 on a scatter graph.