STAT 3005 Lecture Notes - Lecture 7: Floor And Ceiling Functions, Confidence Interval, Test Statistic

12 Apr 2018
School
Department
Course
Professor
Document Summary
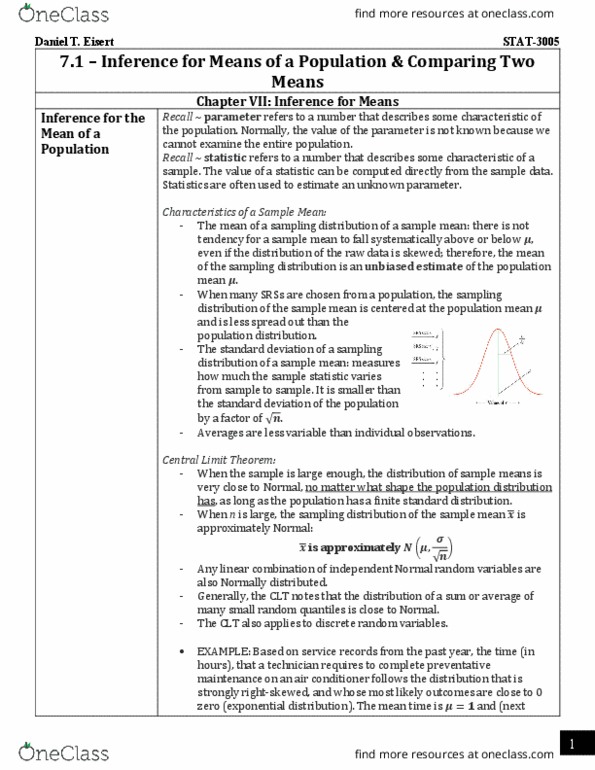
Recall ~ the goal given two independent samples with quantitative responses is to compare two populations where the response is quantitative, examine the difference between two parameters, and construct confidence intervals or perform hypothesis tests. Means: if they are equal, all of the data can be pooled together to get one. There are tests for equality of unknown variances, but they are quite sensitive to departures from normality; therefore, they are not robust. estimates. Generally, consider the variances different if the ratio of larger to smaller variance is more than 4. (cid:1871)(cid:3040)(cid:3028)(cid:3051)(cid:2870)(cid:1871)(cid:3040)(cid:3041)(cid:2870) >(cid:886) or (cid:1871)(cid:3040)(cid:3028)(cid:3051) (cid:1871)(cid:3040)(cid:3041)>(cid:884: assume (cid:2869) (cid:2870) (i. e. (cid:3288)(cid:3118)(cid:3288)(cid:3289)(cid:3118) >(cid:886)), test statistic: (cid:1872)(cid:3042)(cid:3029)=(cid:4666)(cid:3052) (cid:3117) (cid:3052) (cid:3118)(cid:4667) (cid:2868) (cid:4678)(cid:3117)(cid:3118)(cid:3289)(cid:3117)+(cid:3118)(cid:3118)(cid:3289)(cid:3118)(cid:4679)~(cid:1872)(cid:4666)(cid:4667), where (cid:1872)(cid:4666)(cid:4667) represents the degrees of freedom (df). Approximation): approximates the degrees of freedom from the t-test with unequal variance. The floor function (l shaped brackets) denotes rounding down to the: example: consider two plant sciences graduate students working on developing better fertilizers for a particular type of wheat.