STAT 2004 Lecture Notes - Lecture 4: Bar Chart, Ap Statistics, Unimodality

14 Oct 2018
School
Department
Course
Professor
Document Summary
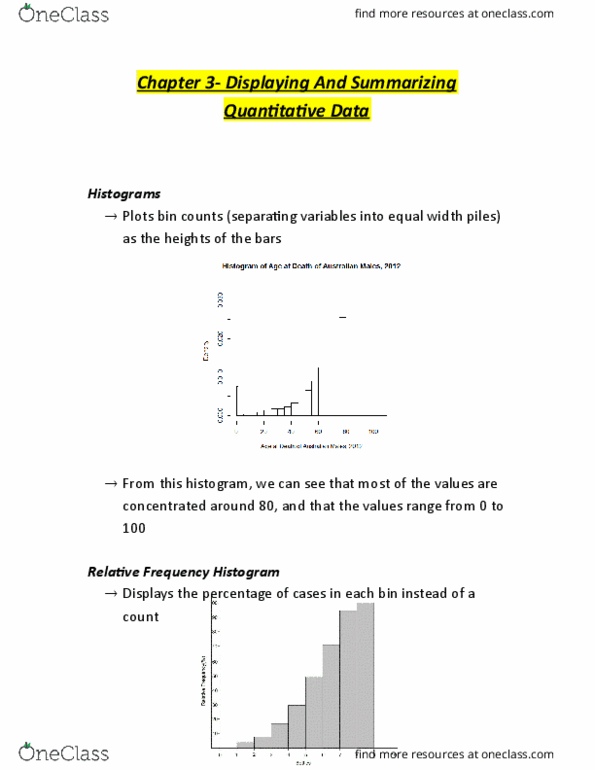
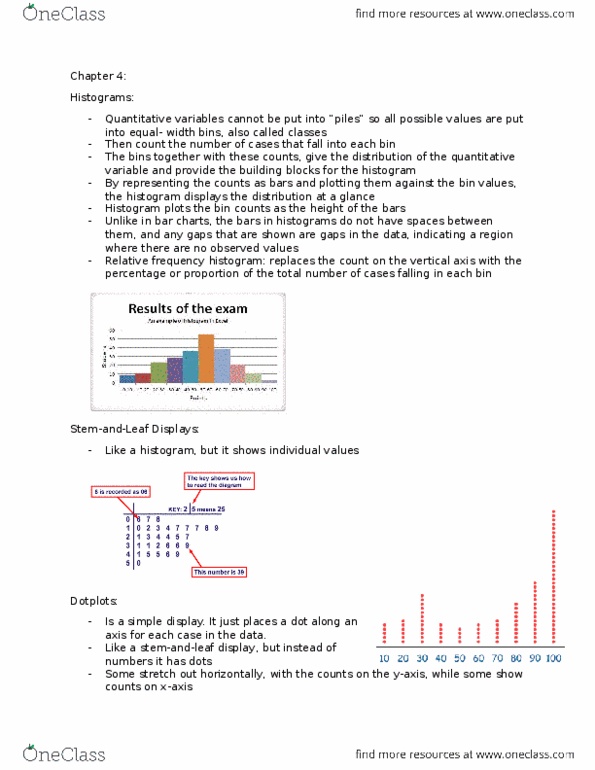
Slice the entire span of values covered by the quantitative variable into equal-width piles these are known as bins. Each bin must be equal in width (i. e. 0-5, 5-10, 10-15, ) and should be touching because the data is represented in numerical order, unlike in a bar chart. Use a histogram to acutely illustrate the distributions. Relative frequency histograms are also appropriate to illustrate data distribution. The y-axis will typically show the percentage of something instead of an amount. Unimodal: one main peak in a given histogram. Bimodal: two main peaks in a given histogram. Multimodal: three main peaks in a given histogram. Uniform: all of the bars are approximately the same height in a given histogram. Unlike a histogram, a stem-and-leaf displays individual values, so the reader can more precisely identify patterns and characteristics (preservation of values). Further separating numbers is acceptable (i. e. 60, 6o, 6t, 6t, 6f, ).