ECON 2005 Lecture Notes - Lecture 29: Lorenz Curve, Property Income, Human Capital

Document Summary
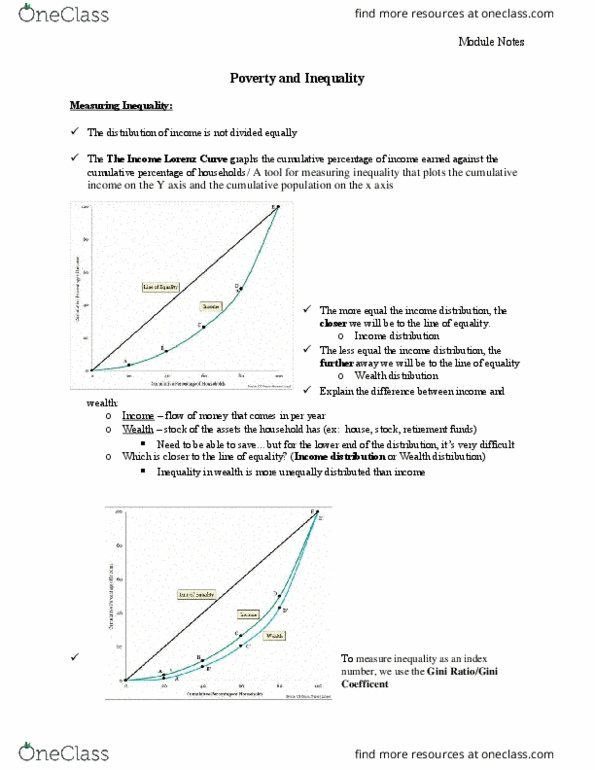
Lorenz curve a widely used graph of the distribution of income, with cumulative percentage of families plotted along the horizontal axis and cumulative percentage of income plotted along the vertical axis. More bowed out from line (line of equality)= more distribution/inequality. Gini coefficient used to measure of inequality of income derived from. It can range from 0 to a max of 1. Is measured as the area of region b/w lorenz curve and the 45 degree line divided by the max possible area. The problem of definition difficult to define precisely, the word poverty is one that we all understand intuitively to some degree. For official purposes we use the poverty line. Poverty line the official established income level that distinguishes the poor from the non poor. It is set at money income equal to three times the cost of dept. of agriculture"s minimum food budget.