ECON 245 Lecture Notes - Lecture 3: Central Tendency, Proportional Representation, Standard Deviation

Document Summary
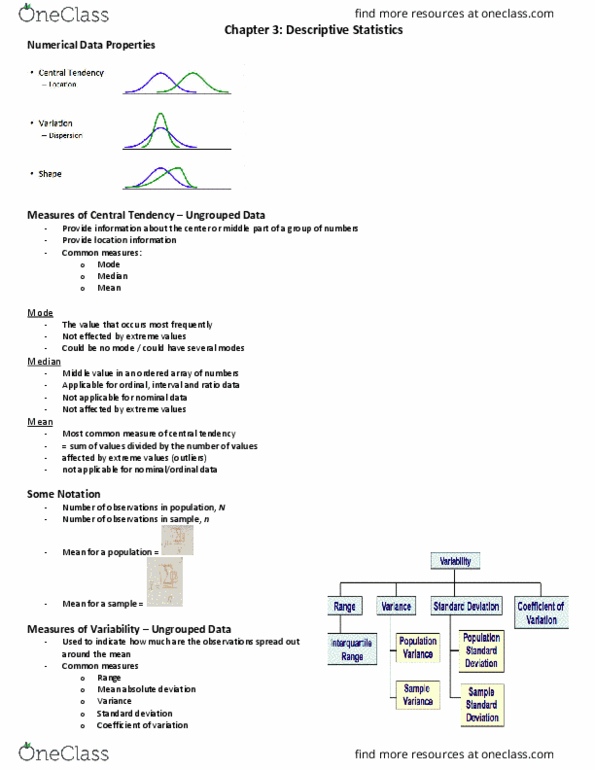
Chapter 2 (ken black) (cont"d: qualitative data graphs: depiction of data in graphs using non numerical categories. Learning objective: use of statistical techniques to describe data, computation of mean, median, mode, standard deviation and variance data. Data: measure of central tendency: it yields information about the center or middle part of a group of numbers. Common measures of central tendency for ungrouped data: mode, median, mean, percentiles, quartiles. For practice questions and examples, refer to class notes: mode: the most frequently occurring value in a data set. Bimodal -- in a tie for the most frequently occurring value, two modes are listed. Multimodal -- data sets that contain more than two modes. Lecture 3: sept 15: median: middle value in an ordered array of numbers. Half the data are above it, half the data are below it. For an array with an odd number of terms, the median is the middle number.