STAT 111 Lecture Notes - Lecture 10: Statistical Inference, Point Estimation, Statistic

3 Oct 2017
School
Department
Course
Professor
Document Summary
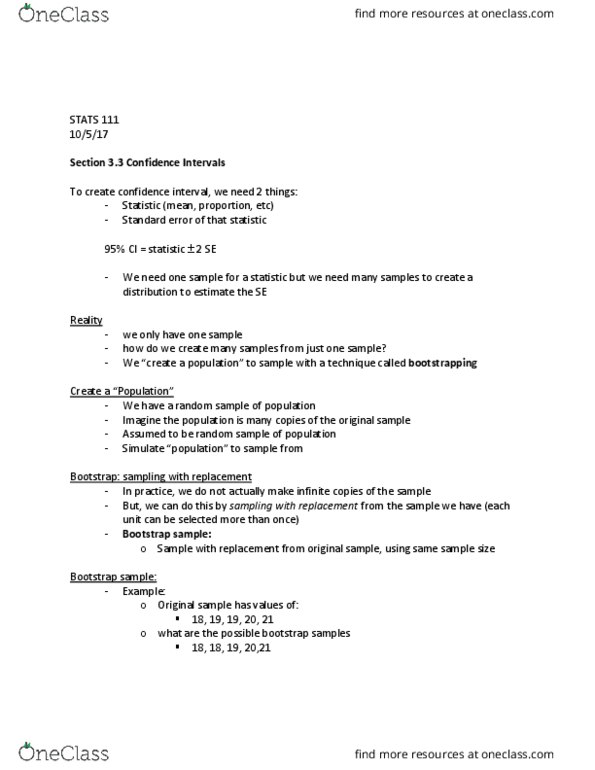
Process of drawing conclusions about entire population based on info in a sample. Use statistic from a sample as a best (point) estimate for a population parameter. Will not match population parameters exactly, they are our best guess, given the data. If we were to take many different samples, the best estimates would vary. Distribution of same statistics computed for different samples of the same size form the same population. Shows us how the sample statistic varies from sample to sample. If samples are randomly selected, the sampling distribution will be centered around population parameter: parameter of interest. Shape: for most of the statistics we consider, if the sample size is large enough, the sampling distribution will be symmetric and bell-shaped. The standard deviation of the sample statistic. Measures how much statistic varies from sample to sample. This variability represents the uncertainty of the statistic. Standard error can be calculated as standard deviation of sampling distribution.