QMB-210 Lecture 8: Quartiles/ Interquartile range/ Box & Whisker plot/ Measures of association between two variables/

7 Feb 2017
School
Department
Course
Professor
Document Summary
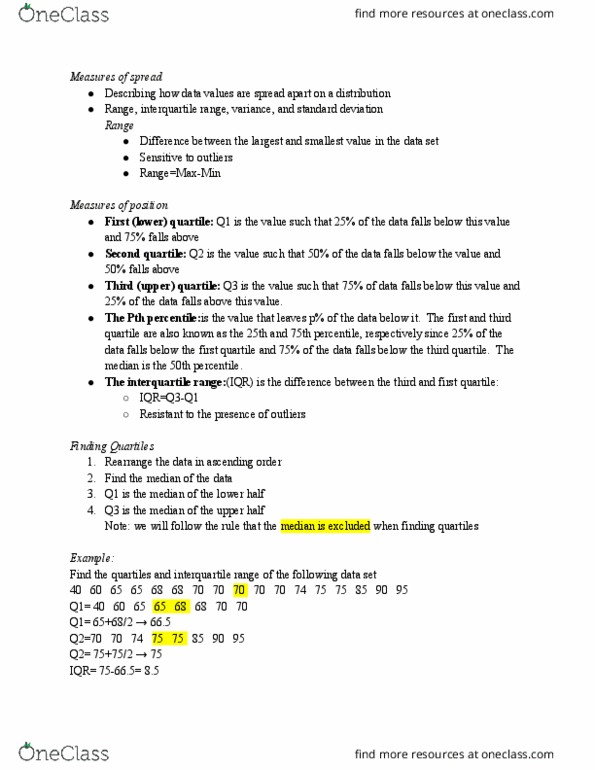
Inter quartile range is the mid 50 percent: q3-q1. Example: find the first quartile: 11, 12, 13, 16, 16, 17, 18, 21, 22, 22, 25, n = 11 because there are 11 observations/ data points. Q1 = 25th percentile, so find the index number i where n = 11 and p = 25: p. 100: so round up and use the value in the 3rd position, so 13. Quartiles can be found in excel with the quartile. exe function. Array = the data range of interest. Quart = 1, 2, or 3 (for the first, second, or third quartile) The interquartile range, iqr, describes the middle 50% of a range: so, between q1 and q3. Find the iqr by subtracting the first quartile from the third quartile. Iqr = q3 q1: the answer should always be a value not a position.