FIN 357 Lecture Notes - Lecture 3: Financial Statement Analysis, Inventory Turnover, Asset Turnover

Get access


Related Documents
Related Questions
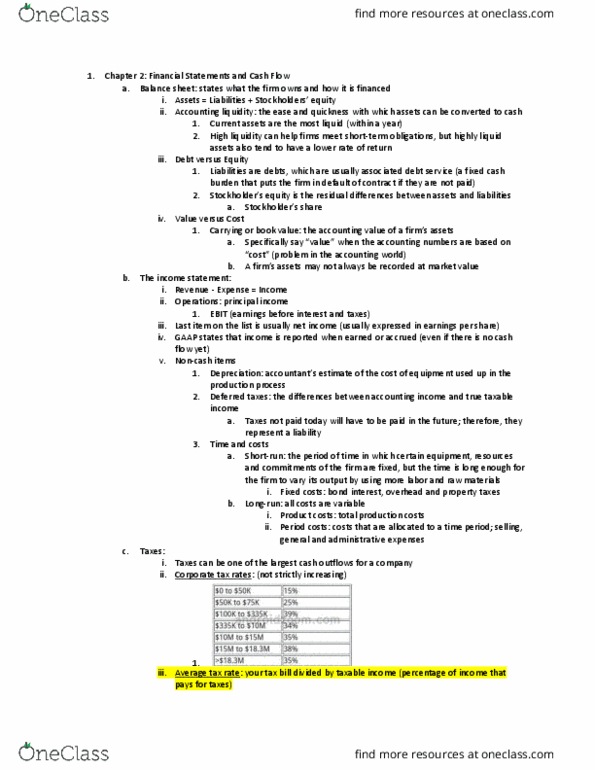
| Joshua & White Technologies: December 31 Balance Sheets | ||||||
| (Thousands of Dollars) | ||||||
| Assets | 2010 | 2009 | ||||
| Cash and cash equivalents | $21,000 | $20,000 | ||||
| Short-term investments | 3,759 | 3,240 | ||||
| Accounts Receivable | 52,500 | 48,000 | ||||
| Inventories | 84,000 | 56,000 | ||||
| Total current assets | $161,259 | $127,240 | ||||
| Net fixed assets | 218,400 | 200,000 | ||||
| Total assets | $379,659 | $327,240 | ||||
| Liabilities and equity | ||||||
| Accounts payable | $33,600 | $32,000 | ||||
| Accruals | 12,600 | 12,000 | ||||
| Notes payable | 19,929 | 6,480 | ||||
| Total current liabilities | $66,129 | $50,480 | ||||
| Long-term debt | 67,662 | 58,320 | ||||
| Total liabilities | $133,791 | $108,800 | ||||
| Common stock | 183,793 | 178,440 | ||||
| Retained Earnings | 62,075 | 40,000 | ||||
| Total common equity | $245,868 | $218,440 | ||||
| Total liabilities and equity | $379,659 | $327,240 | ||||
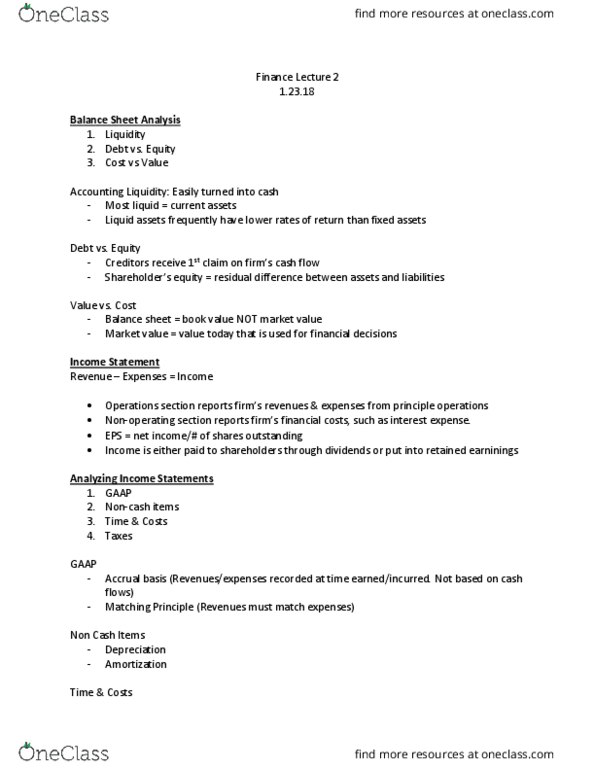
| Joshua & White Technologies December 31 Income Statements | ||||||
| (Thousands of Dollars) | ||||||
| 2010 | 2009 | |||||
| Sales | $420,000 | $400,000 | ||||
| Expenses excluding depr. and amort. | 327,600 | 320,000 | ||||
| EBITDA | $92,400 | $80,000 | ||||
| Depreciation and Amortization | 19,660 | 18,000 | ||||
| EBIT | $72,740 | $62,000 | ||||
| Interest Expense | 5,740 | 4,460 | ||||
| EBT | $67,000 | $57,540 | ||||
| Taxes (40%) | 26,800 | 23,016 | ||||
| Net Income | $40,200 | $34,524 | ||||
| Common dividends | $18,125 | $17,262 | ||||
| Addition to retained earnings | $22,075 | $17,262 | ||||
| Other Data | 2010 | 2009 | ||||
| Year-end Stock Price | $90.00 | $96.00 | ||||
| # of shares (Thousands) | 4,052 | 4,000 | ||||
| Lease payment (Thousands of Dollars) | $20,000 | $20,000 | ||||
| Sinking fund payment (Thousands of Dollars) | $0 | $0 | ||||
| Ratio Analysis | 2010 | 2009 | Industry Avg | |||
| Liquidity Ratios | ||||||
| Current Ratio | 2.38 | 2.52 | 2.58 | |||
| Quick Ratio | 1.17 | 1.41 | 1.53 | |||
| Asset Management Ratios | ||||||
| Inventory Turnover | 1.11 | 1.22 | 7.69 | |||
| Days Sales Outstanding | 45.63 | 43.80 | 47.45 | |||
| Fixed Assets Turnover | 1.92 | 2.00 | 2.04 | |||
| Total Assets Turnover | 3.81 | 5.64 | 1.23 | |||
| Debt Management Ratios | ||||||
| Debt Ratio | 32.1% | |||||
| Times-interest-earned ratio | 15.33 | |||||
| EBITDA coverage ratio | 4.18 | |||||
| Profitability Ratios | ||||||
| Profit Margin | 9.57% | 8.63% | 8.86% | |||
| Basic Earning Power | 19.16% | 18.95% | 19.48% | |||
| Return on Assets | 10.59% | 10.55% | 10.93% | |||
| Return on Equity | 21.87% | 19.35% | 16.10% | |||
| Market Value Ratios | ||||||
| Earnings per share | NA | |||||
| Price-to-earnings ratio | 10.65 | |||||
| Cash flow per share | NA | |||||
| Price-to-cash flow ratio | 7.11 | |||||
| Book Value per share | NA | |||||
| Market-to-book ratio | 1.72 | |||||
| a. Has Joshua & White's liquidity position improved or worsened? Explain. | ||||||
| The position of JW has worsend because there ration has fallen from 1.41 to 1.17 | ||||||
| b. Has Joshua & White's ability to manage its assets improved or worsened? Explain. | ||||||
| c. How has Joshua & White's profitability changed during the last year? | ||||||
| d. Perform an extended Du Pont analysis for Joshua & White for 2008 and 2009. | ||||||
| ROE = | PM x | TA Turnover x Equity Multiplier | ||||
| 2010 | ||||||
| 2009 | ||||||
| e. Perform a common size analysis. What has happened to the composition | ||||||
| (that is, percentage in each category) of assets and liabilities? | ||||||
| Common Size Balance Sheets | ||||||
| Assets | 2010 | 2009 | ||||
| Cash and cash equivalents | ||||||
| Short-term investments | ||||||
| Accounts Receivable | ||||||
| Inventories | ||||||
| Total current assets | ||||||
| Net fixed assets | ||||||
| Total assets | ||||||
| Liabilities and equity | 2010 | 2009 | ||||
| Accounts payable | ||||||
| Accruals | ||||||
| Notes payable | ||||||
| Total current liabilities | ||||||
| Long-term debt | ||||||
| Total liabilities | ||||||
| Common stock | ||||||
| Retained Earnings | ||||||
| Total common equity | ||||||
| Total liabilities and equity | ||||||
| Common Size Income Statements | 2010 | 2009 | ||||
| Sales | ||||||
| Expenses excluding depr. and amort. | ||||||
| EBITDA | ||||||
| Depreciation and Amortization | ||||||
| EBIT | ||||||
| Interest Expense | ||||||
| EBT | ||||||
| Taxes (40%) | ||||||
| Net Income | ||||||
| f. Perform a percent change analysis. What does this tell you about the change in profitability | ||||||
| and asset utilization? | ||||||
| Percent Change Balance Sheets | Base | |||||
| Assets | 2010 | 2009 | ||||
| Cash and cash equivalents | ||||||
| Short-term investments | ||||||
| Accounts Receivable | ||||||
| Inventories | ||||||
| Total current assets | ||||||
| Net fixed assets | ||||||
| Total assets | ||||||
| Base | ||||||
| Liabilities and equity | 2010 | 2009 | ||||
| Accounts payable | ||||||
| Accruals | ||||||
| Notes payable | ||||||
| Total current liabilities | ||||||
| Long-term debt | ||||||
| Total liabilities | ||||||
| Common stock | ||||||
| Retained Earnings | ||||||
| Total common equity | ||||||
| Total liabilities and equity | ||||||
| Base | ||||||
| Percent Change Income Statements | 2010 | 2009 | ||||
| Sales | ||||||
| Expenses excluding depr. and amort. | ||||||
| EBITDA | ||||||
| Depreciation and Amortization | ||||||
| EBIT | ||||||
| Interest Expense | ||||||
| EBT | ||||||
| Taxes (40%) | ||||||
| Net Income | ||||||

| Joshua & White Technologies: December 31 Balance Sheets | ||||||
| (Thousands of Dollars) | ||||||
| Assets | 2010 | 2009 | ||||
| Cash and cash equivalents | $21,000 | $20,000 | ||||
| Short-term investments | 3,759 | 3,240 | ||||
| Accounts Receivable | 52,500 | 48,000 | ||||
| Inventories | 84,000 | 56,000 | ||||
| Total current assets | $161,259 | $127,240 | ||||
| Net fixed assets | 218,400 | 200,000 | ||||
| Total assets | $379,659 | $327,240 | ||||
| Liabilities and equity | ||||||
| Accounts payable | $33,600 | $32,000 | ||||
| Accruals | 12,600 | 12,000 | ||||
| Notes payable | 19,929 | 6,480 | ||||
| Total current liabilities | $66,129 | $50,480 | ||||
| Long-term debt | 67,662 | 58,320 | ||||
| Total liabilities | $133,791 | $108,800 | ||||
| Common stock | 183,793 | 178,440 | ||||
| Retained Earnings | 62,075 | 40,000 | ||||
| Total common equity | $245,868 | $218,440 | ||||
| Total liabilities and equity | $379,659 | $327,240 | ||||
| Joshua & White Technologies December 31 Income Statements | ||||||
| (Thousands of Dollars) | ||||||
| 2010 | 2009 | |||||
| Sales | $420,000 | $400,000 | ||||
| Expenses excluding depr. and amort. | 327,600 | 320,000 | ||||
| EBITDA | $92,400 | $80,000 | ||||
| Depreciation and Amortization | 19,660 | 18,000 | ||||
| EBIT | $72,740 | $62,000 | ||||
| Interest Expense | 5,740 | 4,460 | ||||
| EBT | $67,000 | $57,540 | ||||
| Taxes (40%) | 26,800 | 23,016 | ||||
| Net Income | $40,200 | $34,524 | ||||
| Common dividends | $18,125 | $17,262 | ||||
| Addition to retained earnings | $22,075 | $17,262 | ||||
| Other Data | 2010 | 2009 | ||||
| Year-end Stock Price | $90.00 | $96.00 | ||||
| # of shares (Thousands) | 4,052 | 4,000 | ||||
| Lease payment (Thousands of Dollars) | $20,000 | $20,000 | ||||
| Sinking fund payment (Thousands of Dollars) | $0 | $0 | ||||
| Ratio Analysis | 2010 | 2009 | Industry Avg | |||
| Liquidity Ratios | ||||||
| Current Ratio | 2.38 | 2.52 | 2.58 | |||
| Quick Ratio | 1.17 | 1.41 | 1.53 | |||
| Asset Management Ratios | ||||||
| Inventory Turnover | 1.11 | 1.22 | 7.69 | |||
| Days Sales Outstanding | 45.63 | 43.80 | 47.45 | |||
| Fixed Assets Turnover | 1.92 | 2.00 | 2.04 | |||
| Total Assets Turnover | 3.81 | 5.64 | 1.23 | |||
| Debt Management Ratios | ||||||
| Debt Ratio | 32.1% | |||||
| Times-interest-earned ratio | 15.33 | |||||
| EBITDA coverage ratio | 4.18 | |||||
| Profitability Ratios | ||||||
| Profit Margin | 9.57% | 8.63% | 8.86% | |||
| Basic Earning Power | 19.16% | 18.95% | 19.48% | |||
| Return on Assets | 10.59% | 10.55% | 10.93% | |||
| Return on Equity | 21.87% | 19.35% | 16.10% | |||
| Market Value Ratios | ||||||
| Earnings per share | NA | |||||
| Price-to-earnings ratio | 10.65 | |||||
| Cash flow per share | NA | |||||
| Price-to-cash flow ratio | 7.11 | |||||
| Book Value per share | NA | |||||
| Market-to-book ratio | 1.72 | |||||
| a. Has Joshua & White's liquidity position improved or worsened? Explain. | ||||||
| The position of JW has worsend because there ration has fallen from 1.41 to 1.17 | ||||||
| b. Has Joshua & White's ability to manage its assets improved or worsened? Explain. | ||||||
| c. How has Joshua & White's profitability changed during the last year? | ||||||
| d. Perform an extended Du Pont analysis for Joshua & White for 2008 and 2009. | ||||||
| ROE = | PM x | TA Turnover x Equity Multiplier | ||||
| 2010 | ||||||
| 2009 | ||||||
| e. Perform a common size analysis. What has happened to the composition | ||||||
| (that is, percentage in each category) of assets and liabilities? | ||||||
| Common Size Balance Sheets | ||||||
| Assets | 2010 | 2009 | ||||
| Cash and cash equivalents | ||||||
| Short-term investments | ||||||
| Accounts Receivable | ||||||
| Inventories | ||||||
| Total current assets | ||||||
| Net fixed assets | ||||||
| Total assets | ||||||
| Liabilities and equity | 2010 | 2009 | ||||
| Accounts payable | ||||||
| Accruals | ||||||
| Notes payable | ||||||
| Total current liabilities | ||||||
| Long-term debt | ||||||
| Total liabilities | ||||||
| Common stock | ||||||
| Retained Earnings | ||||||
| Total common equity | ||||||
| Total liabilities and equity | ||||||
| Common Size Income Statements | 2010 | 2009 | ||||
| Sales | ||||||
| Expenses excluding depr. and amort. | ||||||
| EBITDA | ||||||
| Depreciation and Amortization | ||||||
| EBIT | ||||||
| Interest Expense | ||||||
| EBT | ||||||
| Taxes (40%) | ||||||
| Net Income | ||||||
| f. Perform a percent change analysis. What does this tell you about the change in profitability | ||||||
| and asset utilization? | ||||||
| Percent Change Balance Sheets | Base | |||||
| Assets | 2010 | 2009 | ||||
| Cash and cash equivalents | ||||||
| Short-term investments | ||||||
| Accounts Receivable | ||||||
| Inventories | ||||||
| Total current assets | ||||||
| Net fixed assets | ||||||
| Total assets | ||||||
| Base | ||||||
| Liabilities and equity | 2010 | 2009 | ||||
| Accounts payable | ||||||
| Accruals | ||||||
| Notes payable | ||||||
| Total current liabilities | ||||||
| Long-term debt | ||||||
| Total liabilities | ||||||
| Common stock | ||||||
| Retained Earnings | ||||||
| Total common equity | ||||||
| Total liabilities and equity | ||||||
| Base | ||||||
| Percent Change Income Statements | 2010 | 2009 | ||||
| Sales | ||||||
| Expenses excluding depr. and amort. | ||||||
| EBITDA | ||||||
| Depreciation and Amortization | ||||||
| EBIT | ||||||
| Interest Expense | ||||||
| EBT | ||||||
| Taxes (40%) | ||||||
| Net Income | ||||||
Question
Analysis of Financial Statements
Balance Sheets
EXHIBITS: INPUT DATA (XYZ)
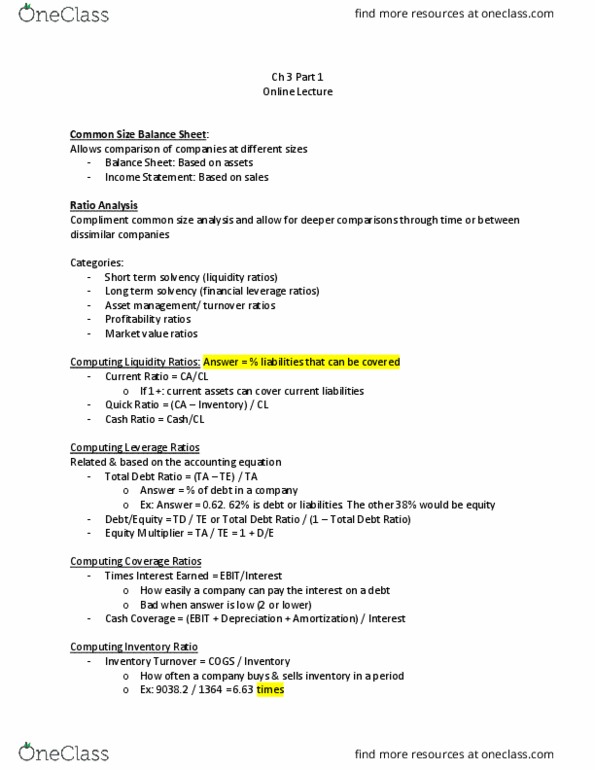
Table 1 Balance Sheets
| Assets | 2013E | 2012 | 2011 |
| cash | $ 85,632 | $7,282 | $57,600 |
| Acount Receivable | 878,000 | 632,160 | 351,200 |
| Inventories | 1,716,480 | 1,287,360 | 715,200 |
| Total current assets | $2,680,112 | $1,926,802 | $ 1,124,000 |
| Gross fixed assets | 1,197,160 | 1,202,950 | 491,000 |
| Less: accumulated depreciation | 380,120 | 263,160 | 146,200 |
| Net fixed assets | $ 817,040 | $ 939,790 | $ 344,800 |
| Total assets | $3,497,152 | $2,866,592 | $ 1,468,800 |
| Liabilities and equity | |||
| Accounts payable | $ 436,800 | $ 524,160 | $ 145,600 |
| Notes payable | 300,000 | 636,808 | 200,000 |
| Accruals | 408,000 | 489,600 | 136,000 |
| Total current liabilities | $1,144,800 | $1,650,568 | $ 481,600 |
| Long term bonds | 400,000 | 723,432 | 323,432 |
| Total debt | $1,544,800 | $2,374,000 | $ 805,032 |
| Common stock (100,000 shares) | 1,721,176 | 460,000 | 460,000 |
| Retained earnings | 231,176 | 32,592 | 203,768 |
| Total common equity | $1,952,352 | $ 492,592 | $ 663,768 |
| Total liabilities and equity | $3,497,152 | $2,866,592 | $ 1,468,800 |
Analysis of Financial Statements
Income Statements
Table 2
Income Statements
| 2013E | 2012 | 2011 | |
| Sales | $7,035,600 | $6,034,000 | $ 3,432,000 |
| Cost of goods sold | 5,875,992 | 5,528,000 | 2,864,000 |
| Other expenses | 550,000 | 519,988 | 358,672 |
| Total operating exp. excl. depreciation and amortization | $6,425,992 | $6,047,988 | $ 3,222,672 |
| EBITDA | $ 609,608 | $(13,988) | $ 209,328 |
| Depreciation and amortization | 116,960 | 116,960 | 18,900 |
| Earnings before interest and taxes (EBIT) | $492,648 | $(130,948) | $190,428 |
| Interest expense | 70,008 | 136,012 | 43,828 |
| Earnings before taxes (EBT) | $ 422,640 | $ (266,960) | $ 146,600 |
| Taxes (40%) | 169,056 | (106,784) | 58,640 |
| Net Income | $ 253,584 | $ (160,176) | $ 87,960 |
| Earnings per share (EPS) | $ 1.014 | $ (1.602) | $ 0.880 |
| Dividends per share (DPS) | $ 0.220 | $ 0.110 | $ 0.220 |
| Book value per share (BVPS) | $ 7.809 | $ 4.926 | $ 6.638 |
| Stock price | $ 12.17 | $ 2.25 | $ 8.50 |
| Shares outstanding | 250,000 | 100,000 | 100,000 |
| Tax rate | 40.00% | 40.00% | 40.00% |
| Lease payments | $ 40,000 | $ 40,000 | $ 40,000 |
| Sinking fund payments | 0 | 0 | 0 |
Analysis of Financial Statements
Ratio Analysis
| 2013E | 2012 | 2011 | Industry Average | |
| Current ratio | * | 1.2 | 2.3 | 2.7 |
| Quick ratio | * | 0.4 | 0.8 | 1.0 |
| Inventory turnover | * | 4.7 | 4.8 | 6.1 |
| Days sales outstanding (DSO) | * | 38.2 | 37.4 | 32.0 |
| Fixed assets turnover | * | 6.4 | 10.0 | 7.0 |
| Total assets turnover | * | 2.1 | 2.3 | 2.6 |
| Debt-to- assets ratio | * | 82.8% | 54.8% | 50.0% |
| Times interest earned (TIE) | * | -1.0 | 4.3 | 6.2 |
| Operating margin | * | -2.2% | 5.6% | 7.3% |
| Profit margin | * | -2.7% | 2.6% | 3.5% |
| Basic earning power (BEP) | * | -4.6% | 13.0% | 19.1% |
| Return on assets(ROA) | * | -5.6% | 6.0% | 9.1% |
| Return on equity (ROE) | * | -32.5% | 13.3% | 18.2% |
| Price/earnings (P/E) | * | -1.4 | 9.7 | 14.2 |
| Market/book (M/B) | * | 0.5 | 1.3 | 2.4 |
| Book value per share (BVPS) | * | $4.93 | $6.64 | n.a. |
Requiremnts:
Note: Question 1 through 5 has been answered completley, thank you very much. Please I am waiting for the question 6 and 7.
6. Use the extended DuPont equation to provide a summary and overview of XYZâs financial condition as projected for 2013.
7. Use the following simplified 2013 balance sheet to show, in general terms, how an improvement in the DSO would tend to affect the stock price. For example, if the company could improve its collection procedures and thereby lower its DSO from 45.6 days to the 32-day industry average without affecting sales, how would that change âripple throughâ the financial statements (shown in thousands below) and influence the stock price?
Accounts receivable $878 Debt $1,545
Other current assets 1,802
Net fixed assets 817 Equity 1,952
Total assets $3,497 Liabilities plus equity $3,497
First, we need to calculate XYZâs daily sales.
Daily sales = Sales / 365
Daily sales = $7,035,600 / 365
Daily sales = $19,275.62
Target A/R = Daily sales à Target DSO
Target A/R = $19,276 Ã 32
Target A/R = $616,820
Freed-up cash = old A/R â new A/R
Freed-up cash = $878,000 â $616,820
Freed-up cash = $261,180