PSYC 241 Lecture Notes - Lecture 2: Percentile Rank, Frequency Distribution, Level Of Measurement

Document Summary
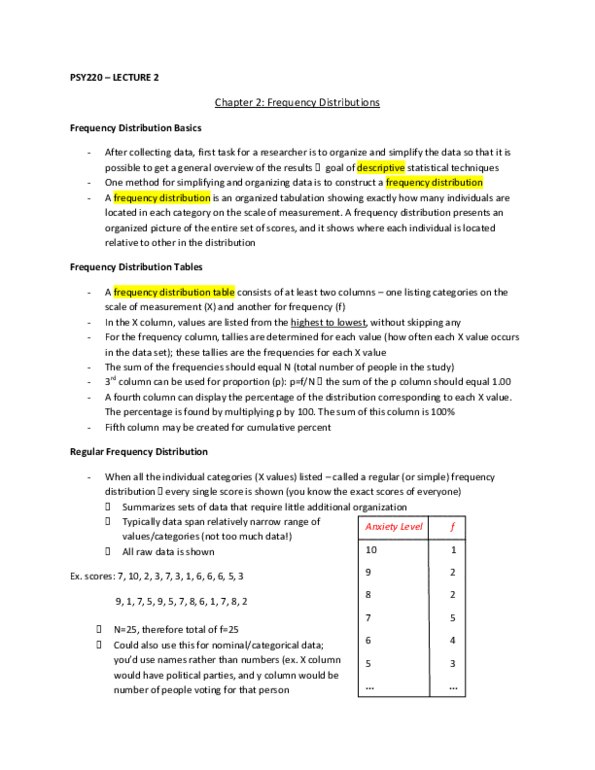
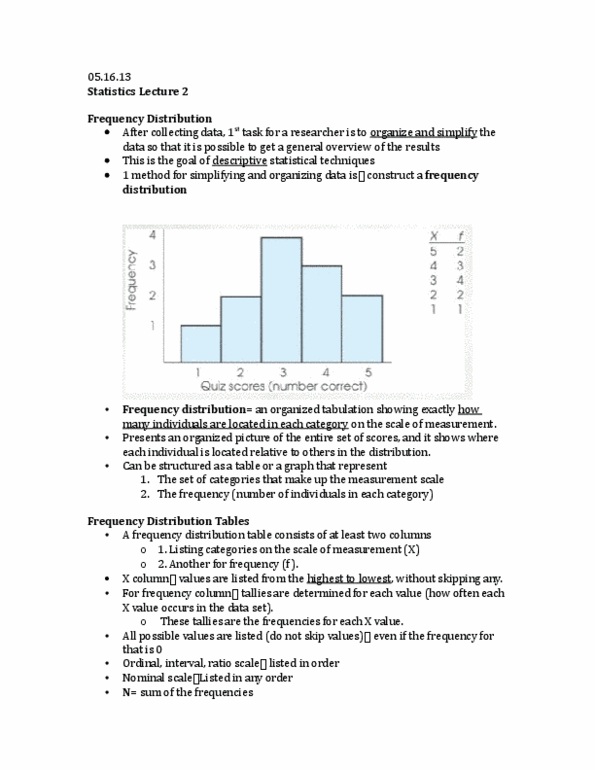
We can describe any data set with three pieces of information. Show how many people are located in each category on the scale of measurement. Present an organized picture of the entire set of scores. Show where each person is located relative to others. Values are listed from the highest to lowest (without skipping any) Tallies for each value (how often each x value occurs in the data set) The sum of the frequencies should equal n. The "x" column contains every possible score. The "f" column indicates the frequency of each score. When a frequency distribution table lists all of the individual categories (x values) it is called a regular frequency distribution. This works well if we have very few scores. For many values (like exam scores), a grouped frequency distribution is used. The x column lists groups of scores, called class intervals, rather than individual values. Width should be simple number (2, 5, 10, 20, etc. )